Covariance Analysis
Identify and repair co-varying sequence violations to optimize antibody stability and folding.
This tool detects residue covariation—the statistical tendency of two position residues in an antibody chain to co-vary and mutate in a correlated fashion. In structural biology, these strongly covarying pairs represent crucial spatial contacts, electrostatic interactions (such as salt bridges), or core packing constraints. When engineering or humanizing an antibody, mutating one partner without the other can break these co-varying constraints, resulting in structural violations that may compromise folding efficiency, stability, or expression.
The goal of Covariance Analysis is to identify these broken constraints and guide users through repairing them by restoring optimal residue pairings, all while tracking mutations in the Engineering workspace to generate stable design variants.
What is OMES?
The analysis is powered by the OMES (Observed Minus Expected Squared) statistical algorithm, calculated over a curated reference database of aligned functional antibody sequences:
- Observed (\(N_{\text{obs}}\)): The actual frequency of a specific amino acid pair (\(aa_i\), \(aa_j\)) at two aligned positions (\(pos_i\), \(pos_j\)) in the reference database.
- Expected (\(N_{\text{exp}}\)): The expected frequency if mutations at these positions occurred independently, calculated from individual residue probabilities.
- Significance: A high OMES score indicates that the residues at these two positions are highly co-dependent. If a user introduces a mutation that violates this dependency, it is flagged as an active violation.
Accessing the Tool
Select exactly one antibody in the Project View. Go to the Analysis menu and select Covariance. This opens the Covariance workspace in a new tab.
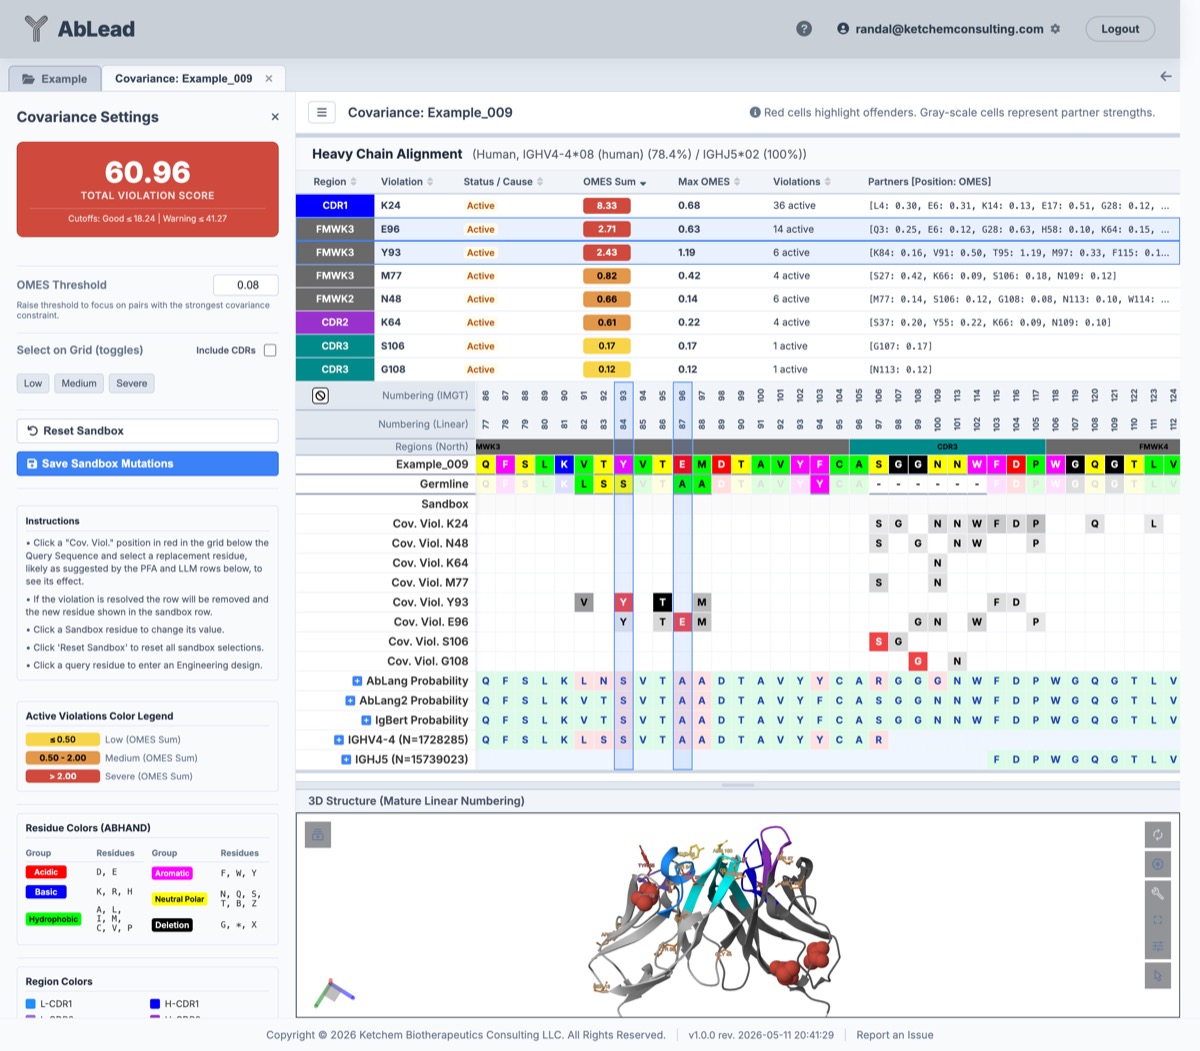
Understanding the Workspace
1. Covariance Settings (Left Sidebar)
- Total Violation Score: The cumulative penalty score of all active covariance violations across both Light and Heavy chains. The goal is to reduce this score by repairing outlier positions. The cumulative score is categorized into three severity ranges based on empirical database distributions:
- Good: \(\le 18.24\)
- Warning: \(18.24 < \text{Score} \le 41.27\)
- Severe: \(> 41.27\)
- OMES Threshold: An editable numeric threshold (default:
0.08). Setting a higher threshold filters out weaker, noisier covariance pairs to help focus on the strongest, most structurally critical constraints. - Select on Grid: Toggles additive selections of columns in the alignment grid and highlights the residues in spacefill inside the 3D viewer.
- Low: Toggles positions with a cumulative OMES Sum \(\le 0.50\).
- Medium: Toggles positions with a cumulative OMES Sum between 0.50 and 2.00.
- Severe: Toggles positions with a cumulative OMES Sum \(> 2.00\) (representing the most critical outliers).
- Reset Sandbox: Reverts all mutations introduced in the Sandbox row back to the parental query sequence.
- Save Sandbox Mutations: Saves the current sandbox mutations to a design set named "Covariance" in the Engineering tool.
- Active Violations Color Legend: Displays the color code boundaries for the OMES Sum values in the summary tables.
2. Sequence Alignment Grid (Center)
- Query Sequence: The original parental sequence of the antibody.
- Germline: Evaluate the closest germline. Use the Germline tool for more detail.
- Sandbox Row: A row where you can test mutations. Clicking a cell opens a selector popover suggesting alternative amino acids. If a sandbox mutation resolves a covariance violation, the violation row is removed in real-time.
- Covariance Violation Rows: Highlighted in red. They show the offending residue and trace the locations of its violated partner positions (colored by partner strength relative to the threshold).
- PFA & LLM Rows: Display standard statistical frequencies and deep-learning recommendations (AbLang, AbLang2, IgBert) to guide your mutation choices.
3. Active Violations Summary Table
Located below the sequence grid, this table lists all offending residues and can be sorted by clicking column headers. It implements a three-way sort (Descending → Ascending → Default unsorted/position order) indicated by interactive sort icons next to each column title:
- Region (Sortable): Click to sort by region alphabetically. Vernier zone residues are denoted with a
(V). - Violation (Sortable): Click to sort by sequence position (linear flow order).
- Status / Cause (Sortable): Click to group residues by their active, repaired, or new status.
- OMES Sum (Sortable, Default): Click to sort by cumulative constraint strength. Highly critical outliers appear at the top.
- Max OMES (Sortable): Click to sort by maximum single-pair constraint score.
- Violations (Sortable): Click to sort by the number of active partner violations for the position.
- Partners: Lists the partner residues and their respective pair-wise OMES scores.
- Clicking any row in the table smoothly scrolls the alignment grid to focus on that position and highlights/selects the corresponding column.
4. 3D Structure Viewer (Bottom)
An integrated PDBe Molstar viewer maps your selections in real-time:
- Covarying positions are rendered in ball-and-stick mode.
- Offenders are colored by severity (Yellow for Low, Orange for Medium, and Red for Severe OMES Sums).
- Selecting a column in the sequence grid changes that residue's representation to spacefill in the 3D model, allowing you to visually inspect its packing, hydrogen bonding, or electrostatic environment.
Step-by-Step Repair Workflow
- Identify the Outliers: Look at the top of the Active Violations Summary Table (sorted by OMES Sum descending) or click Severe in the sidebar. These are your primary repair targets.
- Evaluate Sandbox Alternatives: Click the red offender cell in the grid's Sandbox row. Review the PFA frequencies and LLM language model recommendations to find a high-probability alternate residue.
- Resolve the Violation: Select an alternative residue (often restoring a parental germline amino acid or matching a highly conserved PFA residue). If the selection satisfies the covariance constraint, the corresponding red violation row will disappear, and the Total Violation Score will drop.
- Balance Binding and Stability: Ensure that mutations to resolve covariance violations do not disrupt critical CDR binding residues. Focus mutations on the framework region (FMWK) where repair is highly effective for improving thermal stability and folding without affecting affinity.
- Commit the Designs: Once the sandbox is clear of severe violations, click Save Sandbox Mutations to transfer the selections to the Engineering workspace.
- Build Variants: Navigate to the Engineering tool, generate combinatorial variants if desired, and build your newly optimized, stable antibody candidates.
References
- The OMES algorithm and amino acid covariance calculation are detailed in Fodor, A. A., & Aldrich, R. W. "Influence of conservation on calculations of amino acid covariance in multiple sequence alignments." Proteins: Structure, Function, and Bioinformatics, 56(2) (2004): 211–221.
- Residue co-varying sectors and structural networks in proteins are discussed in Halabi, N., Rivoire, O., Leibler, S., & Ranganathan, R. "Protein sectors: evolutionary units of three-dimensional structure." Cell, 138(4) (2009): 774–786.
- The use of residue interaction networks for stability analysis and protein engineering is reviewed in de la Cruz, R., & Radomski, J. P. "Using residue interaction networks to understand protein function and evolution and to engineer new proteins." Current Opinion in Structural Biology, 88 (2024): 102922.