Alignment
Visualizes the sequence alignment of your antibodies using standard numbering schemes.
This tool is useful for evaluating differences between sequences and for generating IP claims around functional positions.
Accessing the Tool
Select at least one antibody in the Project View. Go to the Analysis menu and select Alignment. This will open the Alignment workspace in a new tab.
Variable Region
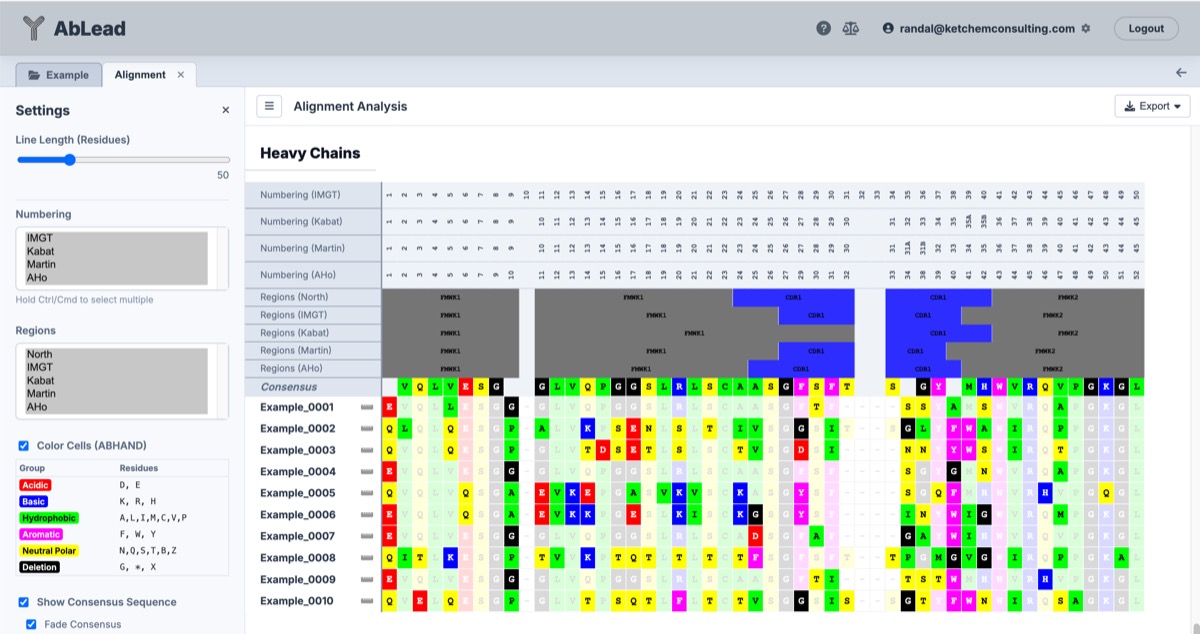
Germlines, Liabilities, and Paratope
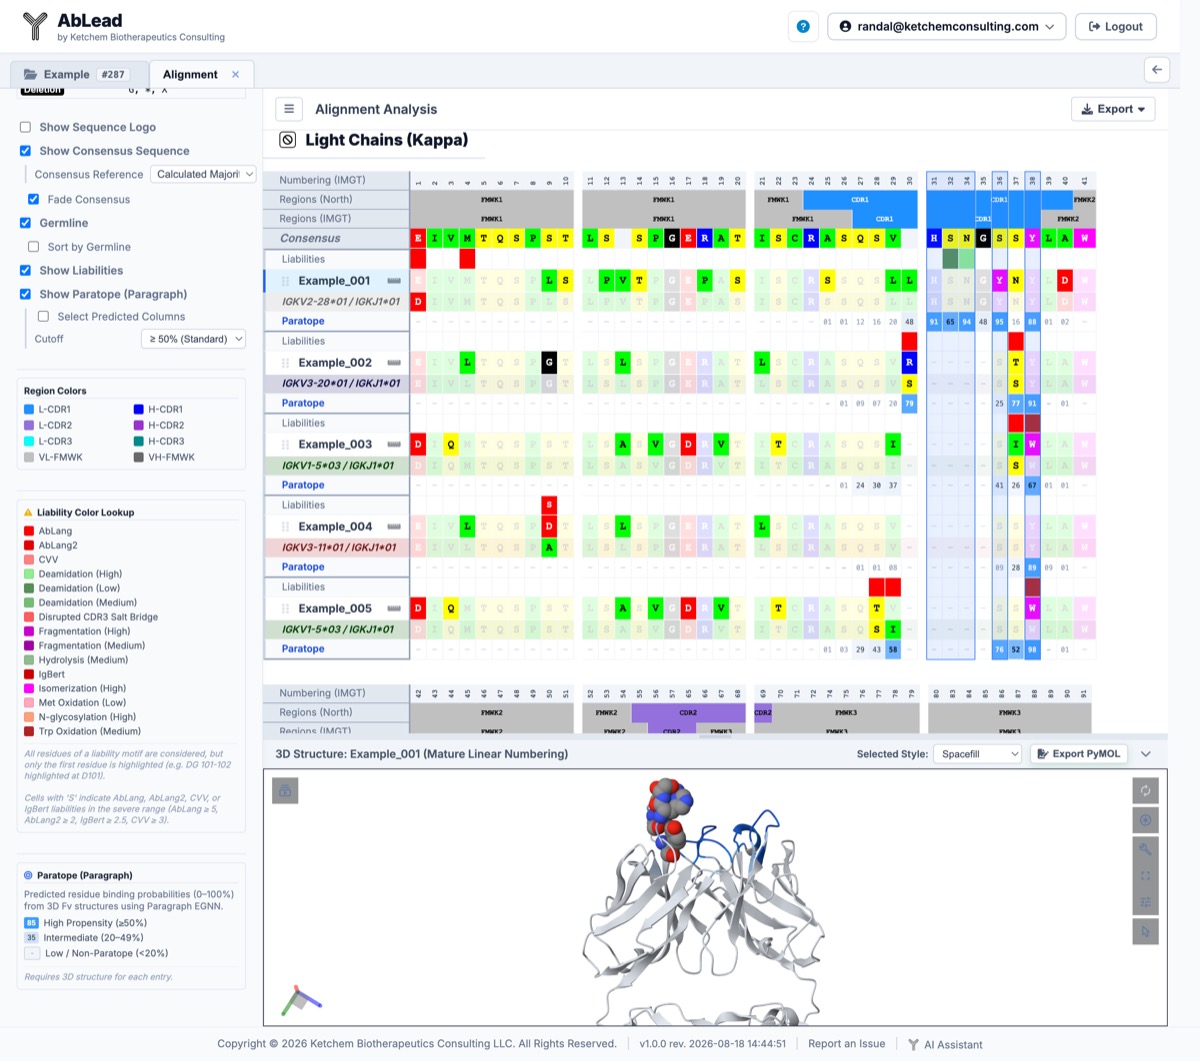
Using the Tool
- Grouping: Sequences are grouped by chain type (Kappa, Lambda, Heavy).
-
Settings
- Domains: The Leader, Variable, and Constant regions may be displayed.
-
Numbering and Regions: The numbering and region scheme may be changed by selecting different schemes from their respective selection boxes.
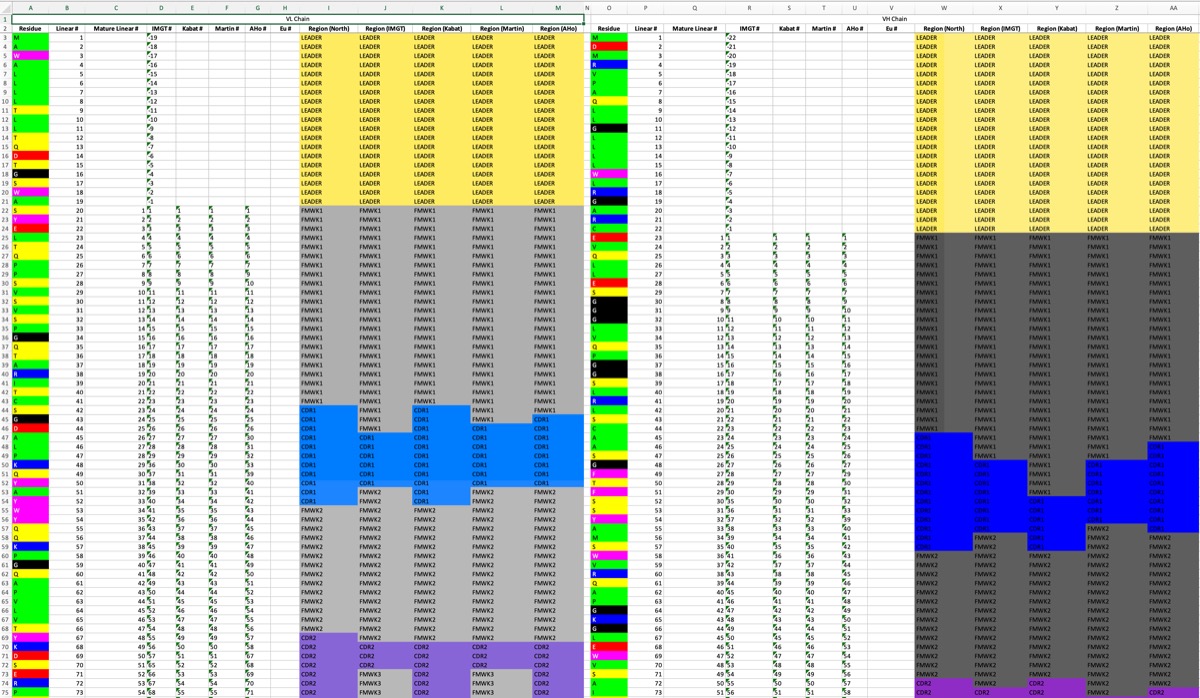
- Leader sequences are numbered negatively from the start of the variable domain.
- Constant domains are numbered based on an alignment of the germline sequences for that region.
-
Line Length (Residues): Set the number of residues displayed per chunk line in the alignment view (default
50residues per line). - Gap Every (Residues): Specify a residue interval (default
0) to insert a clean visual vertical separator column every N residues across all chunk tracks (numbering scheme headers, region bars, sequence logos, consensus sequence, linear/mature linear tracks, sequence liabilities, antibody residue rows, and closest germlines). Setting this to0renders sequences contiguously without gutters. The gap spacing is preserved in Excel export (as narrow spacer columns) and in Sequence Logo SVG exports. - Color Residues: The residues may be colored or not based on ABHAND.
- Consensus: A consensus sequence may be displayed at the top of each group.
- Consensus Reference: Select between
Calculated Majority(default majority-rule baseline) or any specific sequence entry in the project as the consensus baseline. Selecting a specific entry underlines that sequence's name in the grid and Excel exports. Any section containing chains for that selected entry (e.g. Lambda and Heavy for a Lambda antibody) will use the selected entry's sequence as its consensus baseline and underline theConsensusrow label, while sections where the entry is absent (e.g. Kappa) will fall back to calculating section majority with an un-underlinedConsensuslabel. - Fade Consensus: Toggle this option to gray out residues that match the selected Consensus Reference, highlighting mutations and unique features relative to the reference sequence or majority consensus.
- Germline: Toggle this option to display the closest matching V and J germline sequence directly beneath each antibody entry across Light (Kappa/Lambda) and Heavy chains. The germline row is styled in standard ABHAND residue colors and faded where residues match the entry sequence, making somatic mutations and germline deviations instantly identifiable. The row header displays the specific assigned V and J germline gene call (e.g.
IGHV1-69*01 / IGHJ4*01). Drag-and-drop reordering keeps the germline row grouped with its parent entry. - Show Liabilities: Toggle this option to display a dedicated liabilities row directly above each antibody sequence row. Sequence liability motifs (Deamidation, Isomerization, Cleavage, N-glycosylation, Methionine Oxidation, Tryptophan Oxidation, Unusual/Missing Cysteines, Disrupted CDR3 Salt Bridges, and Custom Motifs) and language model framework/stability penalties (AbLang, AbLang2, IgBert, and CVV) are highlighted at the motif's first residue using standard liability colors. Positions with severe language model score differences (exceeding severe thresholds) display an S indicator in high-contrast text.
- Liability Color Lookup: The settings sidebar includes a permanent Liability Color Lookup reference card showing all active liability color swatches, full liability names, and explanatory notes on motif start residue highlighting and severe language model thresholds.
-
Show Paratope (Paragraph): Toggle this option to display a dedicated structure-based paratope prediction row directly beneath each antibody sequence row. Using the Paragraph Equivariant Graph Neural Network (EGNN), residue-level antigen-binding probabilities (\(0.0\text{--}1.0\)) are predicted directly from 3D Fv structures (such as those generated by ABodyBuilder2 or experimentally determined) without requiring prior knowledge of the target epitope. Scores are displayed as percentage probabilities and color-coded by binding propensity:
- High Confidence (\(\ge 50\%\)): Bold blue background with high-contrast text, marking canonical antigen-contact residues.
- Intermediate Propensity (\(20\text{--}49\%\)): Soft light blue background, capturing peripheral or secondary contact candidates.
- Low Propensity (\(<20\%\)): Neutral muted background, representing framework and non-contact positions.
-
Select Predicted Columns: When Show Paratope (Paragraph) is active, a nested sub-setting allows you to automatically select all alignment columns whose predicted paratope probability meets or exceeds a configurable cutoff:
- Cutoff Options: Choose from \(\ge 50\%\) (Standard default), \(\ge 60\%\), \(\ge 70\%\) (Core hotspots), \(\ge 40\%\), \(\ge 30\%\), and \(\ge 20\%\) (Inclusive).
- 3D Synchronization: Selected columns are framed with blue selection boxes in the sequence alignment grid and simultaneously rendered as spacefill spheres in the integrated 3D Mol* structure viewer.
-
Paratope Color Legend: When paratope predictions are displayed, the settings sidebar renders an interactive reference legend showing the prediction score tiers and their corresponding background colors.
-
Sequence Logo: Toggle this option to render dynamic stacked amino acid sequence logos above each chain group, displaying position conservation and residue frequency proportions colored by ABHAND.
- Logo Height (px): Adjust the row height setting (default
84px) directly in the toolbar to scale letter stacks vertically for optimal residue legibility.
- Logo Height (px): Adjust the row height setting (default
-
Linear Sequence: Click the icon next to the entry name to toggle the linear and mature linear number displays above a sequence.
- 3D Structure Viewer: Click any antibody entry name to open or close the integrated 3D Mol* viewer pane at the bottom of the Alignment window, rendering cartoon ribbons with region or paratope colors and displaying selected residue columns in spacefill.
-
Export
- Export Numbering Sheet: Exports the sequences with all numbering and region depictions (including aligned germline residues in each per-Fv tab).
- Export Alignment Excel: Opens an export dialog allowing you to customize included tracks and display options (including optional linear/mature linear residue numbering, consensus sequence, fade consensus, closest germline, germline sorting, liabilities with severe S indicators, and gap spacer columns) before downloading the Excel file.
- Export Sequence Logos (SVG): Exports multi-chain Sequence Logo tracks (Kappa, Lambda, Heavy) with active primary scheme position numbering, framework/CDR region annotations, and configured Gap Every spacing as a scalable vector graphic (
.svg). - Export Sequence Logos (PNG): Exports multi-chain Sequence Logo tracks with active primary scheme position numbering and framework/CDR region annotations as a high-resolution PNG image (
.png).
-
Engineering Mutation Designs: Click a residue to enter a mutation design used by the Engineering tab.
- Observations: Click a residue to enter an observation for that IMGT position. These are displayed in the Observations tab and on a clicked residue.
- Reorder Sequences: Click and drag the grip icon on the left side of a sequence row to reorder the sequences within their chain group. Note that this will also reorder the entry in the chain group for the other chain.
- Indicator Dots: Dots on a residue position indicate that there is an associated engineering design or observation at that position. Engineering mutations will appear as a small eggshell square while observations will appear as a small orange circle.
Sequence Logos
The Alignment view features interactive, high-resolution Sequence Logos to visualize position conservation and amino acid variation across all aligned sequences.
Features
- Proportional Letter Stacking: Residue frequencies at each position are represented as stacked amino acid letters scaled proportionally to their occurrence across the aligned set.
- Automatic 2x Column & Logo Expansion: Enabling Show Sequence Logo automatically doubles the column width from
20pxto40px(44pxin exports) and scales the SVG logo letter glyphs 2x wider horizontally using SVGtextLength="16.5"(lengthAdjust="spacingAndGlyphs"), stretching every amino acid letter to fill 92% of the column width for crisp, bold, edge-to-edge logos with minimal side margins. - Vertical Buffer Separation: Inserted a crisp vertical buffer gap between multi-letter stack items so dark letter outlines remain distinct and separated without merging.
- Sans-Serif Font Stack & Selective 'I' Rendering: Sequence logo stacks utilize modern sans-serif fonts (
"ArialMT",Arial,Helvetica,"DejaVu Sans",sans-serif). Standard letters are scaled horizontally (textLength="16.5") to fill the column width, while Isoleucine (I) is selectively rendered at its natural proportional width centered in the cell so it appears as a clean, crisp, bold vertical barIwithout wide box distortion. - Dynamic Height Setting: Use the Logo Height (px) control below the Show Sequence Logo checkbox to set custom row heights (default
150px, configurable from30pxup to200px). - Baseline Clipping: Stacked glyphs utilize precision baseline clipping (
#logoBaselineClip) so font descender tails (such asQ) sit flush without overlapping adjacent letters or disrupting row margins. - Multi-Chain & Region Mapped Exports: Exporting to SVG or PNG generates complete multi-chain figures (Kappa, Lambda, Heavy) mapped with primary scheme position numbering (e.g., IMGT, Kabat) positioned above framework/CDR region header bars (
FMWK1–FMWK4,CDR1–CDR3).
Excel Export
Clicking Export > Alignment opens a configuration modal prior to download, allowing fine-grained control over which tracks and styles are included in the generated spreadsheet:
-
Per-Entry Residue Numbering:
- Linear Numbering: Emits a 1-based sequential position row above each antibody sequence.
- Mature Linear Numbering: Emits a 1-based sequential position row starting at the first residue of the mature variable domain (numbering leader residues negatively).
- Default: Both options are unchecked by default to produce compact workbooks. A master checkbox toggles both options simultaneously.
-
Display Options:
- Show Consensus Sequence: Includes the consensus sequence row at the top of each chain group.
- Fade Consensus: Grays out residues matching the active consensus reference or calculated majority to highlight sequence divergence.
- Show Closest Germline: Appends closest V and J germline sequence rows directly beneath each entry sequence.
- Sort by Germline: Reorders sequence entries within each chain section according to their assigned germline gene calls.
- Show Sequence Liabilities: Adds formatted liability rows above each sequence with motif highlights and severe language model S indicators.
- Default: These display settings automatically synchronize with your current Alignment sidebar selections, while allowing per-export overrides in the dialog.
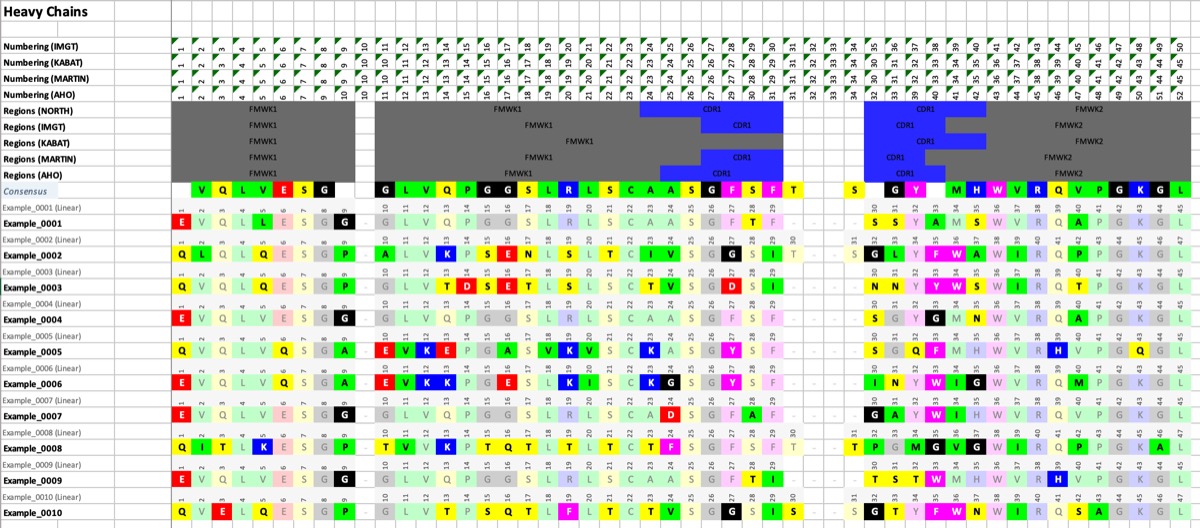
Numbering Sheet
Numbering Sheet Set

Numbering Sheet Entry
Interactive 3D Structure Viewer (Mol*)
The Alignment workspace includes an integrated 3D molecular structure viewer pane positioned at the bottom of the page, powered by PDBe Mol*.
Features
- One-Click Entry Trigger: Click any antibody entry name in the alignment grid to smoothly expand the 3D viewer pane and load that candidate's 3D structure. The active entry row is highlighted with a soft blue background and an accent border. Clicking the active entry name again, or clicking the collapse toggle in the pane header, smoothly closes the viewer.
- Resizable Split Pane: Drag the handle at the top of the viewer pane to adjust its height dynamically between 150px and the full viewport height. The pane remembers your preferred height across toggles.
-
Standardized Region and Paratope Ribbon Coloring:
- Region Mode (Default): The cartoon ribbon is automatically colored by antibody functional regions (CDRs, Frameworks, and constant domains) according to the project's color palette.
- Paratope Mode: When Show Paratope (Paragraph) is enabled in the sidebar, the ribbon color scheme automatically switches to reflect residue binding propensities, highlighting predicted paratope contact residues in vibrant blue.
-
Column Selection and Spacefill Representation:
- Clicking any column header or residue cell in the alignment grid selects that column and renders the corresponding residue as a spacefill sphere on the 3D structure.
- Enabling Select Predicted Columns under the Paratope settings automatically selects and displays all predicted paratope residues as spacefill on the active structure.
- The Selected Style dropdown in the viewer header allows you to switch between Spacefill and Ball and Stick representations.
-
PyMOL Script Export: Click the Export PyMOL button in the viewer header to download a complete PyMOL
.pmlscript that recreates the active 3D visualization, including chain identifiers, region coloring, and spacefill selections.
Paratope Prediction (Paragraph)
Paratope prediction identifies the specific residues on an antibody variable domain that directly engage the antigen. In AbLead, paratope predictions are powered by Paragraph, an open-source Equivariant Graph Neural Network (EGNN) developed by the Oxford Protein Informatics Group (OPIG).
Methodology
- Structure-Based Modeling: Unlike sequence-only paratope predictors that rely on sequence patterns alone, Paragraph incorporates 3D atomic coordinates from antibody Fv structures. This enables it to consider the precise spatial architecture of the antigen-binding surface, CDR loop conformations, and inter-chain orientations.
- Epitope-Agnostic: Paragraph requires no structural or sequence information about the antigen or epitope, making it applicable to novel discovery panels, orphan binders, and uncomplexed models.
- Continuous Probability Output: Paragraph calculates a binding propensity score between \(0.0\) and \(1.0\) for each residue in the heavy and light variable domains.
-
Decision Cutoffs:
- \(\ge 50\%\) (Standard Default): The literature-standard decision threshold identified by Deszyński et al., which provides an optimal balance between precision (\(\approx 75\text{--}80\%\)) and recall (\(\approx 85\text{--}90\%\)).
- \(\ge 70\%\) (Core Hotspots): Highly stringent filter focusing on key energetic hotspots that bury significant surface area upon antigen binding.
- \(\ge 20\text{--}30\%\) (Inclusive / Periphery): Captures peripheral residues and flexible loop regions that may participate in secondary or water-mediated interactions.
-
Prerequisites: Paratope calculation requires a 3D structure (either generated within AbLead via Build Models using ABodyBuilder2 or uploaded as experimental PDB or mmCIF files). For entries without 3D models, the paratope row displays
Paratope (No 3D).
References
- Paragraph: Deszyński, P., Moal, I. H., Galson, J. D., Quast, N., and Deane, C. M. (2023). Paragraph—antibody paratope prediction using graph neural networks with minimal feature vectors. Bioinformatics, 39(1), btac732. https://academic.oup.com/bioinformatics/article/39/1/btac732/6825310
- ImmuneBuilder (ABodyBuilder2): Abanades, B., Georges, G., Bujotzek, A., and Deane, C. M. (2023). ImmuneBuilder: Deep-Learning models for predicting the structures of antibodies, atypical antibodies, and T-cell receptors. Communications Biology, 6(1), 575. https://doi.org/10.1038/s42003-023-04927-7
- PDBe Mol*: Sehnal, D., Bittrich, S., Deshpande, M., Svobodová, R., Berka, K., Bazgier, V., Velankar, S., Burley, S. K., Koča, J., and Rose, A. S. (2021). Mol Viewer: modern web app for 3D visualization and analysis of large biomolecular structures. Nucleic Acids Research*, 49(W1), W431–W437. https://molstar.org/