Physical Properties
Detailed breakdown of calculated physicochemical properties.
This tool is useful for evaluating the physical properties of antibodies across variable (Fv) and full-length constructs.
Accessing the Tool
Select at least one antibody in the Project View. Go to the Analysis menu and select Physical Properties. This will open the Physical Properties workspace in a new tab.
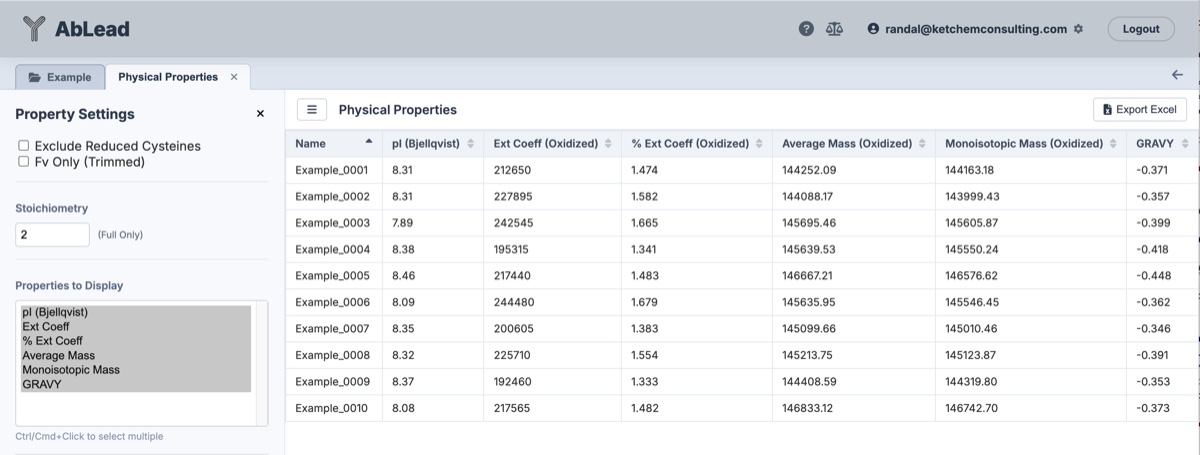
Calculated Properties
Isoelectric Point (\(\text{pI}\)) Calculation Methods
The isoelectric point (\(\text{pI}\)) is the pH at which the net electrical charge of the antibody molecule equals zero (\(Z(\text{pH}) = 0\)). AbLead provides both sequence-based scales and empirical 3D structure-based calculations:
- pI (Bjellqvist) (Default): Classical Henderson-Hasselbalch calculation utilizing sequence-specific \(\text{p}K_a\) values from Bjellqvist et al. (1993, 1994), accounting for residue-dependent N-terminal (\(\text{Ala}, \text{Met}, \text{Ser}, \text{Pro}, \text{Thr}, \text{Val}, \text{Glu}\)) and C-terminal (\(\text{Asp}, \text{Glu}\)) ionization constants.
-
pI (PROPKA / Bjellqvist):
- Fv Scope (
pI (PROPKA Fv)): Runs PROPKA 3 directly on the 3D atomic coordinates of the variable domain (Fv), computing \(\text{p}K_a\) perturbations driven by structural microenvironments, buried salt bridges (e.g., conserved \(\text{V}_\text{H}\) \(\text{Arg94/98}\)–\(\text{Asp86/101}\)), and local charge crowding. - Full Construct Scope (Hybrid Method): Integrates 3D structural electrostatics for the Fv domain via PROPKA with sequence-based Bjellqvist titration for the constant domains (\(\text{C}_\text{H}1\text{--}\text{hinge}\text{--}\text{C}_\text{H}2\text{--}\text{C}_\text{H}3\) and \(\text{C}_\text{L}\)). Because the flexible hinge physically separates Fv and Fc beyond the Debye electrostatic screening distance (\(\lambda_D \approx 8\,\text{Å}\) at \(150\,\text{mM}\,\text{NaCl}\)), this hybrid calculation accurately predicts full-length folded \(\text{pI}\) without requiring full-length crystallographic models. If an entry has no associated 3D structure, this column displays
—.
- Fv Scope (
-
pI (IPC Protein): Computationally optimized \(\text{p}K_a\) scale derived by Kozlowski (2016) via non-linear regression on large experimental protein datasets, achieving lower RMSD against intact proteins than classical tables.
- pI (IPC Peptide): Optimized \(\text{p}K_a\) scale from Kozlowski (2016) tailored for short peptides and fragments.
- pI (EMBOSS): Standard scale used across European Molecular Biology Open Software Suite tools (
iep). - pI (Solomon): Established classical scale from Solomon (1987).
- pI (Sillero): Classical scale from Sillero & Ribeiro (1989).
- pI (Rodwell): Widely cited scale from Rodwell (1982).
- pI (Lehninger): Classical biochemical constants from Nelson & Cox (2008).
- pI (Grimsley): Empirical \(\text{p}K_a\) parameters from Grimsley et al. (2009).
- pI (Toseland): \(\text{p}K_a\) parameters from Toseland et al. (2006).
- pI (Thurlkill): Titration constants from Thurlkill et al. (2006).
- pI (Dawson): Classical parameters from Data for Biochemical Research (Dawson et al., 1986).
- pI (ProMoST): 2D-PAGE optimized \(\text{p}K_a\) set from Halligan et al. (2004).
Conditional Formatting: All displayed \(\text{pI}\) columns in both the interactive grid and Excel export are dynamically color-coded using the active Format Preferences or project Format Preset (Good: Green
#88B46C, Low / Warning: Yellow#F8D548, High / Severe: Red#CF4A3C).
General Physicochemical Properties
- Ext Coeff: Molar extinction coefficient (\(\text{M}^{-1}\text{cm}^{-1}\)) at \(280\,\text{nm}\) calculated for reduced (all Cys as free thiols) and oxidized (all paired Cys as cystines) states.
- % Ext Coeff: Percentage extinction coefficient (\(E^{1\%}_{1\,\text{cm}} = \text{Ext Coeff} / \text{MW}\)), representing the absorbance of a \(10\,\text{mg/mL}\) solution.
- Average Mass: Average molecular weight (\(\text{Da}\)) accounting for atomic isotope distributions, multimeric chain stoichiometry, and water addition per chain terminus.
- Monoisotopic Mass: Exact monoisotopic mass (\(\text{Da}\)) based on the most abundant natural isotopes (\(^{12}\text{C}, ^{1}\text{H}, ^{14}\text{N}, ^{16}\text{O}, ^{32}\text{S}\)).
- GRAVY: Grand Average of Hydropathy (Kyte & Doolittle, 1982). Negative values indicate hydrophilic/soluble constructs, while positive values indicate hydrophobic tendencies.
- Multi-Column Sorting: Click any column header to sort by that property. Clicking additional column headers builds an interactive multi-column sort hierarchy (primary, secondary, etc.) with rank badges (
[1],[2]). Each column features a 3-way toggle (Ascending\(\rightarrow\)Descending\(\rightarrow\)Remove). Clearing or removing all sorts immediately restores the default sort by antibody name (Nameascending).
Export Options
The toolbar features an Export dropdown menu providing both file downloads and direct project metadata integration:
- Excel (.xlsx): Generates a formatted spreadsheet containing all selected physical properties.
-
To Results...: Opens a modal to save all currently displayed physical property columns and values directly into project results metadata (categorized under Other directly after Notes).
- Column Prefix: Allows specifying an optional prefix (defaults to
Fvwhen Fv Only is selected, or empty for full-length mAb constructs) to clearly distinguish domain scopes in the project results table. - Columns to Export Preview: Displays a real-time preview of all properties to be exported based on current sidebar selections (selected \(\text{pI}\) scales, extinction coefficients, molecular weights, and GRAVY across reduced or oxidized states).
- Batch Project Metadata Sync: Saves properties across all matching antibodies in a single transaction. Columns appear dynamically in the main project results table, are included in standard CSV/Excel exports under Other, and trigger seamless real-time updates across open project tabs.
- Column Prefix: Allows specifying an optional prefix (defaults to
References
- Bjellqvist Method: Bjellqvist, B., et al. “The focusing positions of polypeptides in immobilized pH gradients can be predicted from their amino acid sequences.” Electrophoresis 14, no. 1 (1993): 1023–1031. https://doi.org/10.1002/elps.11501401163; and Electrophoresis 15, no. 1 (1994): 529–539. https://doi.org/10.1002/elps.1150150171.
- PROPKA 3: Søndergaard, C. R., et al. “Improved Treatment of Ligands and Coupling Effects in Empirical Calculation and Rationalization of pKa Values.” Journal of Chemical Theory and Computation 7, no. 7 (2011): 2284–2295. https://doi.org/10.1021/ct200133y.
- IPC (Isoelectric Point Calculator): Kozlowski, L. P. “IPC – Isoelectric Point Calculator.” Biology Direct 11, no. 55 (2016). https://doi.org/10.1186/s13062-016-0159-9.
- EMBOSS: Rice, P., et al. “EMBOSS: the European Molecular Biology Open Software Suite.” Trends in Genetics 16, no. 6 (2000): 276–277. https://doi.org/10.1016/S0168-9525(00)02024-2.
- Solomon Scale: Solomon, T. W. G. Organic Chemistry, 3rd ed. New York: John Wiley & Sons, 1987.
- Sillero Scale: Sillero, A., and J. M. Ribeiro. “Isoelectric points of proteins: theoretical determination.” Analytical Biochemistry 179, no. 2 (1989): 319–325. https://doi.org/10.1016/0003-2697(89)90136-X.
- Rodwell Scale: Rodwell, J. D. “Heterogeneity of component bands in isoelectric focusing patterns.” Analytical Biochemistry 119, no. 2 (1982): 440–449. https://doi.org/10.1016/0003-2697(82)90611-X.
- Lehninger Scale: Nelson, D. L., and M. M. Cox. Lehninger Principles of Biochemistry, 5th ed. New York: W. H. Freeman and Company, 2008.
- Grimsley Scale: Grimsley, G. R., J. M. Scholtz, and C. N. Pace. “A summary of the measured pK values of the ionizable groups in folded proteins.” Protein Science 18, no. 1 (2009): 247–251. https://doi.org/10.1002/pro.19.
- Toseland Scale: Toseland, C. P., H. McSparron, M. N. Davies, and D. R. Flower. “PPD v1.0—an integrated, web-accessible database of experimentally determined protein pKa values.” Nucleic Acids Research 34, no. suppl_1 (2006): D199–D203. https://doi.org/10.1093/nar/gkj035.
- Thurlkill Scale: Thurlkill, R. L., G. R. Grimsley, J. M. Scholtz, and C. N. Pace. “pK values of the ionizable groups of proteins.” Protein Science 15, no. 5 (2006): 1214–1218. https://doi.org/10.1110/ps.051840806.
- Dawson Scale: Dawson, R. M. C., D. C. Elliott, W. H. Elliott, and K. M. Jones. Data for Biochemical Research, 3rd ed. Oxford: Clarendon Press, 1986.
- ProMoST: Halligan, K. E., et al. “ProMoST (Protein Modification Screening Tool): a web-based tool for calculating the isoelectric point and molecular weight of modified proteins.” Proteomics 4, no. 8 (2004): 2252–2260. https://doi.org/10.1002/pmic.200300762.
- Biopython ProtParam: Gasteiger, E., et al. “Protein Identification and Analysis Tools on the ExPASy Server.” In The Proteomics Protocols Handbook, pp. 571–607. Humana Press, 2005.
- GRAVY (Kyte-Doolittle): Kyte, J., and R. F. Doolittle. “A simple method for displaying the hydropathic character of a protein.” Journal of Molecular Biology 157, no. 1 (1982): 105–132. https://doi.org/10.1016/0022-2836(82)90515-0.