Position Frequency Analysis (PFA)
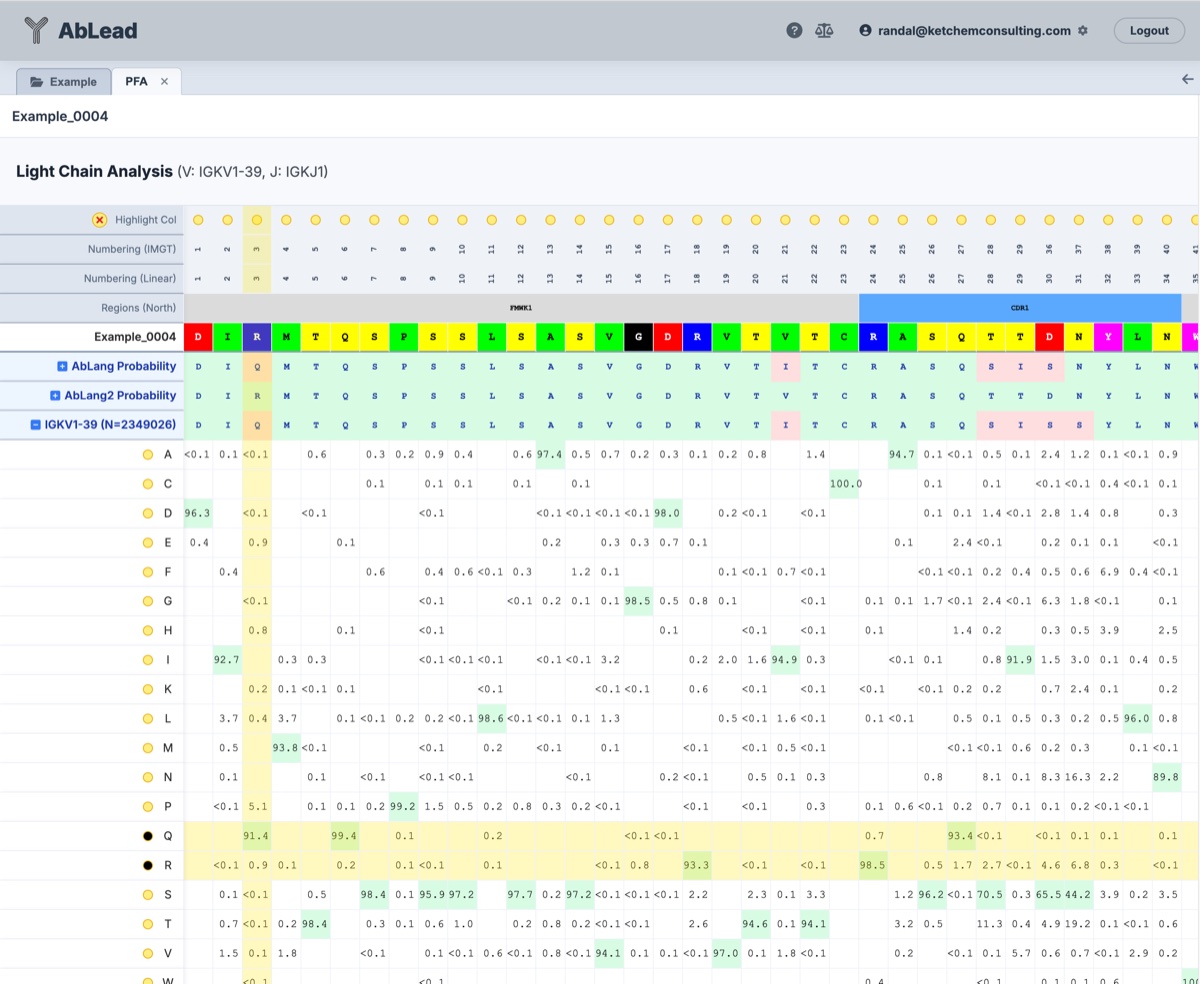
The PFA view provides a statistical and LLM-based breakdown of amino acid distributions at each position.
This tool is useful for identifying specific likelihoods and probabilities for each position in the antibody sequences. It is particularly useful for selecting mutations in antibody engineering and developability optimization. Note that human germlines are searched regardless of parent species.
PFA is a great example to Be Inherently Lazy. Pulling together the individual LLM grids and statistics on the closest human germlines manually would take a long time and is prone to error. Let the tool handle it for you.
Accessing the Tool
Select exactly one antibody in the Project View. Go to the Analysis menu and select PFA. This will open the PFA workspace in a new tab.
Using the Tool
- Liabilities: A liabilities row above the sequence indicates residue liabilities that could require repair or closer consideration for engineering. An 'S' in a liability cell indicates a Severe stability violation.
- Coloring: Highest frequency or likelihood residues are indicated by red highlighting of the sequence.
- Germline: Evaluate the closest germline. Use the Germline tool for more detail.
- Grid Exposure: Open a grid to visualize the probabilities for all residues at each position. Note that human germlines are searched regardless of parent species.
- Engineering Mutation Designs: Click a residue to enter a mutation design used by the Engineering tab.
- Observations: Click a residue to enter an observation for that IMGT position. These are displayed in the Observations tab and on a clicked residue.
- Export Excel: Click to export an Excel version of the grids.
- Indicator Dots: Dots on a residue position indicate that there is an associated engineering design or observation at that position. Engineering mutations will appear as a small eggshell square while observations will appear as a small orange circle.
Model Grids & Repertoire Frequency Analysis
The PFA workspace provides per-residue predictions from multiple complementary antibody language models and repertoire statistical datasets alongside germline gene frequency tables. These models differ in their training data species (human-only versus human and mouse) and whether they evaluate single chains or paired Fv domains:
-
PFA Frequency Grids (V-Gene & J-Gene): Statistical frequency distribution calculated from the AntPack repertoire dataset of 58,788,431 heavy chain and 68,454,444 light chain sequences. This dataset is human only and evaluated on a single chain basis against the closest assigned human germlines. If no PFA data exists for the exact closest human germline allele, the tool automatically uses the closest human germline with data in the reference set (annotated in the chain title).
-
Sapiens Probability: Deep learning masked language model trained exclusively on human only antibody repertoires (OAS human data). Sapiens is evaluated on a single chain basis using dedicated human heavy and light chain models, calculating the predicted human likelihood distribution (0.0–1.0) across all 20 amino acids for each position in the variable domain.
-
AbLang (AbLang-1) Probability: Antibody language model trained on both human and mouse antibody sequences. AbLang operates on a single chain basis (evaluating heavy and light chains independently) and outputs log-likelihood scores for each residue position.
-
AbLang2 Probability: Second-generation antibody language model trained on both human and mouse sequences. AbLang2 is a paired chain model that processes both heavy and light chains together, capturing inter-chain context and interface effects across the full Fv domain.
-
IgBert Probability: Masked antibody transformer language model trained on both human and mouse antibody sequences. In AbLead, IgBert is evaluated in paired chain mode (concatenating the heavy and light variable domains separated by a
[SEP]delimiter), evaluating positional likelihoods and softmax probabilities within the structural context of the paired antibody interface.
A higher positive likelihood or probability value indicates higher model preference for a given residue at that position. The difference between the parental residue's score and the highest predicted residue indicates the severity of a potential defect, highlighting positions where substitutions can improve stability, human likeness, or developability.
3D Structure Visualization & Residue Selection
The PFA workspace includes an interactive PDBe Mol* 3D structure viewer positioned below the grids, allowing real-time mapping of sequence changes to the three-dimensional antibody structure.
-
Interactive Resizer: Drag the horizontal divider bar directly above the 3D window up or down to adjust the vertical height of the viewer pane.
-
Cartoon Region Coloring: The ribbon structures of the light and heavy chains are colored by region to match the centralized color schemes:
- Variable Domain (Fv): Frameworks (dim gray/silver) and CDRs (blues, purples, cyans) are colored according to domain region standards.
- Constant Domains: Reconstructed constant domains (CL, CH1, hinge, CH2, CH3) are automatically rendered and colored by their specific sub-domain region colors.
-
Selected Residue Highlighting:
- Clicking column headers in the alignment grids (scheme position or linear number) highlights those columns in blue.
- The corresponding residues on the 3D structure are instantly highlighted in CPK element coloring (with position number labels), regardless of which exclusion method is active.
- Residue Style: Toggle the dropdown to change the rendering style of selected residues between Spacefill (default) and Ball-and-Stick.
References
-
AntPack dataset and PFA methodology are described in Gisby et al., Bioinformatics (2024).
-
Sapiens details are described in Prihoda et al., mAbs (2022).
-
AbLang details are described in Olsen et al., Bioinformatics Advances (2022).
-
AbLang2 details are described in Olsen et al., bioRxiv (2024).
-
IgBert details are described in Kenlay et al., arXiv (2024).