Library Evaluation & Import
High-throughput quality control, domain completeness validation, clonal deduplication, abundance profiling, and candidate selection for NGS (FASTQ) and FASTA antibody libraries.
This tool is designed for processing next-generation sequencing datasets (Illumina MiSeq/HiSeq, PacBio, Oxford Nanopore) and multi-clone libraries from phage display, yeast display, mammalian display, single-cell B-cell discovery, and hybridoma screening campaigns. The pipeline enforces strict structural validation to filter out sequencing artifacts, primer-dimers, and non-productive fragments before ingesting clean candidates into AbLead for downstream developability assessment and engineering.
Accessing the Tool
From the main Dashboard, navigate to File > Import Library in the top navigation bar.
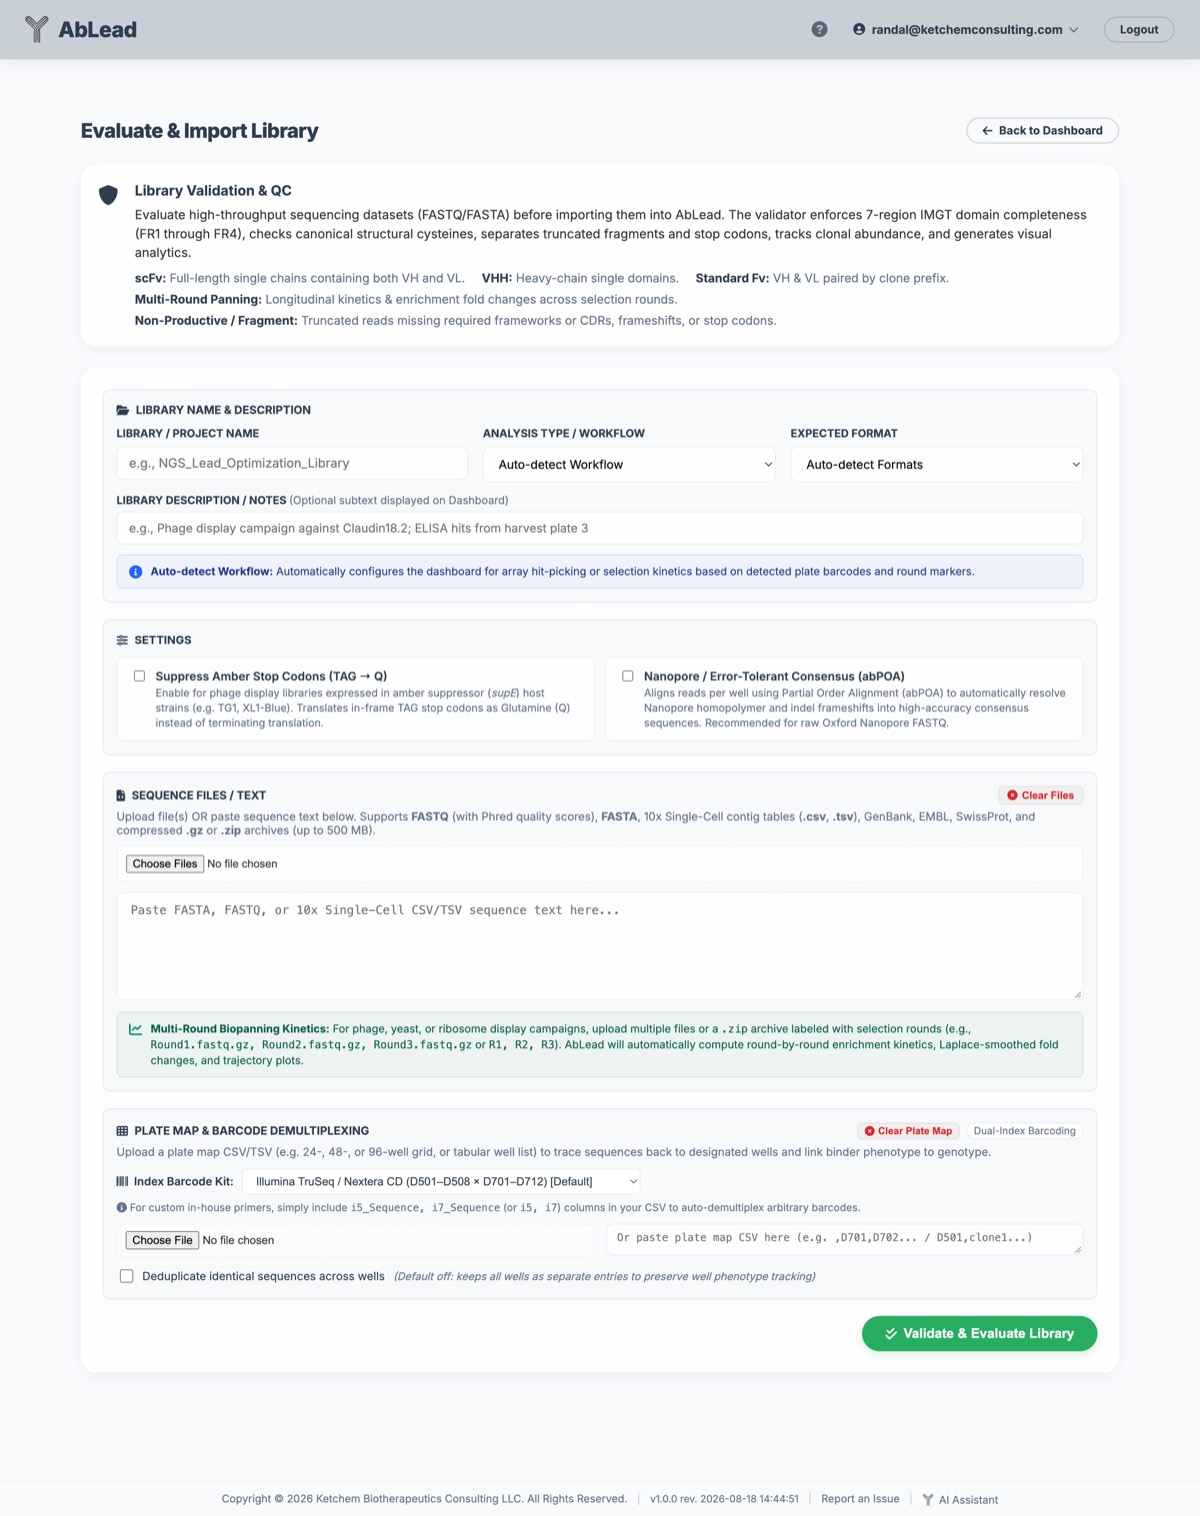
Upload & Archive Ingestion
The ingestion engine handles diverse file formats, compressed archives, and multi-file datasets directly in memory without requiring manual decompression or pre-formatting:
-
Supported File Formats: FASTQ (
.fastq,.fq), FASTA (.fasta,.fa), GenBank (.gb,.genbank), EMBL (.embl), SwissProt (.swiss,.dat), Clustal (.aln,.clustal), CSV/TSV (.csv,.tsv), and raw text files. -
Direct Archive Decompression:
- ZIP Archives (
.zip): Upload multi-file zip packages containing individual FASTQ or FASTA files. The system recursively extracts, merges, and validates all contained sequences in memory. - Multi-Round Biopanning Archives: Packages containing selection rounds labeled by file name (e.g.
Round1.fastq.gz,Round2.fastq.gz,Round3.fastq.gzorR1.fq,R2.fq,R3.fq) are automatically recognized as longitudinal panning rounds for enrichment kinetics analysis. - GZIP Files (
.gz): Compressed single-file or paired-read archives (.fastq.gz,.fq.gz,.fasta.gz) are decompressed on the fly.
- ZIP Archives (
-
Expected Format Selection:
- scFv (Single-Chain Variable Fragment): Evaluates paired heavy and light chains connected by a flexible linker.
- VHH (Single-Domain / Camelid Nanobody): Evaluates single heavy chain variable domains.
- Paired Fv / Fab: Evaluates paired heavy and light chains labeled with
_HC/_LCnaming conventions. - Auto-Detect (Default): Automatically determines the architecture of each read based on domain content and sequence length.
-
Analysis Type & Workflow Selection: AbLead adapts the evaluation pipeline, summary metrics, candidate grids, and visual analytics to match the experimental screening strategy:
-
Auto-Detect Workflow (Default): Automatically inspects uploaded sequence files, read headers, and plate configurations. Resolves intelligently to:
- Single-Cell AIRR: When 10x cell barcodes (
filtered_contig,cell_id,barcode) are present. - Deep Mutational Scanning (DMS): When saturation mutagenesis tokens or input vs selected files are detected.
- FACS Sort-Seq: When gate tokens (
Gate1,Gate2,High,Med,Low,Neg) are detected. - Cross-Reactivity: When parallel condition targets (e.g.
HumanvsCyno,TargetvsCounter) are detected. - Synthetic & Pre-Selection QC: When naive or unselected baseline library files are provided.
- Hit Picking (Barcodes): When plate maps or well adapter barcodes are detected.
- Hybridoma Paired Fv Recovery: When separate Heavy and Light amplicon files or headers (
_HC/_LC,_VH/_VL, orHeavy/Light) are detected. - Biopanning Enrichment: When multi-round identifiers (
R1,R2,Round 3) are detected. - Hit Picking (No Barcodes): Standard unbarcoded screening fallback.
- Single-Cell AIRR: When 10x cell barcodes (
-
Hit Picking (with Barcodes / Plate Map): Tailored for screening campaigns where colonies picked from primary assays (e.g. binding ELISAs, functional assays, or round-3 harvest plates) are pooled across barcoded wells (24-, 48-, or 96-well plates) for cost-effective multiplexed sequencing. Treats multiple FASTQ files as pooled sequencing batch submissions rather than sequential selection rounds. Suppresses artificial biopanning kinetics, fold-change calculations, and depletion trajectories while emphasizing physical well coordinates, within-well sequence purity (
% of well), cross-well redundancy (Shared Seq), and intact paired chain completeness (VL + VH). - Biopanning Enrichment Analysis: Tailored for phage, yeast, ribosome, or mammalian display selection campaigns where libraries undergo sequential rounds of antigen panning. Tracks longitudinal enrichment fold-change, calculates \(\log_2(\text{FC})\), classifies clone kinetics (
Enriching,Stable,Depleting,Fluctuating), and renders interactive multi-round trajectory charts. - Cross-Reactivity & Specificity Screening: Parallel screening comparison evaluating target selectivity versus counter-targets (e.g. Target vs Counter, or Human vs Cynomolgus monkey ortholog). Calculates target-to-counter ratio, \(\log_2(\text{Ratio})\), and classifies clones into
Target-Specific,Cross-Reactive,Counter-Enriched, orLow Abundance. - Deep Mutational Scanning (DMS): Evaluates site-saturation mutagenesis libraries against a parental template. Computes residue-level \(\log_2(\text{Enrichment})\) fitness landscapes across all IMGT framework and CDR positions, classifies substitutions as
Safe/ToleratedversusDeleterious, and provides direct bidirectional integration with AbLead's Engineering workspace. - FACS Sort-Seq Multi-Gate Binning: Evaluates fluorescent multi-gate sorting fractions (e.g. High, Medium, Low, Negative gates). Computes gate population distributions and weighted apparent affinity scores (\(0\text{--}100\)) for high-throughput binning.
- Single-Cell AIRR Repertoire Profiling: Ingests single-cell B-cell receptor (BCR) contigs (such as 10x Genomics Cell Ranger outputs). Groups sequences by single-cell barcodes, pairs heavy and light chains per cell, and computes clonal burst expansion sizes and somatic hypermutation (SHM) divergence rates.
- Synthetic & Pre-Selection Library QC: Baseline quality control for unselected, naive, or synthetic antibody libraries. Quantifies functional open reading frame (ORF) percentage, premature stop codon and frameshift burden, Chao1 non-parametric diversity species richness, and per-position Shannon entropy (\(H(X)\)) diversity profiles.
- Hit Picking (No Barcodes): Direct clone screening for non-barcoded sequencing files without microplate coordinates or multi-round panning kinetics.
- Hybridoma Paired Fv Recovery: Dual-amplicon single-cell or hybridoma screening pairing separate Heavy and Light amplicons.
-
-
Library Description & Experimental Notes: Researchers can provide an optional description or experimental annotation (e.g. screening campaign, target, or harvest plate) when evaluating a library. These notes are preserved in the database, included in
.ziparchive manifests, and displayed directly as subtext beneath the library name on the main Dashboard and in the active evaluation banner. Notes can be edited at any time directly on the Dashboard or banner. -
Phred Quality Score Processing: When parsing FASTQ data, per-base Phred ASCII characters are translated into numerical quality scores (\(Q = \text{ord}(c) - 33\)) and averaged across each read to evaluate sequencing confidence.
-
Pre-Flight Plate Map Validation: If an optional plate map is uploaded alongside sequence files, AbLead automatically checks for formatting artifacts (such as empty delimiter rows), duplicate barcodes, or kit mismatches before sequencing data transfer begins, displaying actionable resolution options in an interactive modal if issues are found.
-
One-Click Input Reset Controls: Dedicated Clear Files and Clear Plate Map buttons on the evaluation dialog enable instant clearing of selected files, pasted textareas, or plate map inputs without requiring a full page refresh.
Required Files & Input Formats by Workflow
Each screening and engineering modality has specific input file structures, naming conventions, and optional accessory files. The table below summarizes the requirements for each workflow, followed by detailed file specifications.
| Workflow Mode | Primary Files Needed | File Formats | File Naming Tokens / Conventions | Optional Accessories |
|---|---|---|---|---|
| Hit Picking (Barcodes) | 1+ pooled multiplexed sequencing files | .fastq, .fq, .fastq.gz, .fasta, .zip |
Any (e.g. batch1_pooled.fastq.gz) |
Plate Map CSV/TSV/Excel (.csv, .tsv, .xlsx) |
| Biopanning Enrichment | 2+ longitudinal selection round files | .fastq, .fq, .fastq.gz, .fasta, .zip |
Round1, Round2, Round3 or R1, R2, R3, cycle_1 |
Baseline reference / unpanned library |
| Cross-Reactivity | 2 condition files (Target vs Counter) | .fastq, .fq, .fastq.gz, .fasta, .zip |
Target: human, hu, target, pos Counter: cyno, counter, mouse, neg |
— |
| Deep Mutational Scanning (DMS) | 2 files (Input vs Selected) or 1 DMS matrix | .fastq, .fq, .fastq.gz, .fasta, .csv, .tsv |
Input: input, pre_sel, naive, baseline Selected: selected, bound, post_sel Matrix: dms, saturation, mutational_scan |
Parental reference sequence (>Parental) |
| FACS Sort-Seq | 2 to 4 fluorescent sorting gate files | .fastq, .fq, .fastq.gz, .fasta, .zip |
Gate tiers: gate_high, gate_med, gate_low, gate_neg, bin1–bin4 |
— |
| Single-Cell AIRR | 1 single-cell contig annotation table or FASTA | .csv, .tsv, .fasta, .fastq, .zip |
filtered_contig_annotations.csv, airr_rearrangement.tsv, 10x, single_cell |
Putative germline reference |
| Synthetic & Pre-Selection QC | 1 baseline unselected library file | .fastq, .fq, .fastq.gz, .fasta, .zip |
naive, synthetic, pre_panning, baseline_lib, design_qc |
In silico library design profile |
| Hybridoma Paired Fv | 2+ paired heavy and light amplicon files | .fastq, .fq, .fastq.gz, .fasta, .zip |
Heavy: _HC, _VH, Heavy, IGH Light: _LC, _VL, Light, IGK, IGL |
Plate map for paired well coordinates |
| Hit Picking (No Barcodes) | 1+ unbarcoded sequencing files | .fastq, .fq, .fastq.gz, .fasta, .zip |
Any (e.g. colony_picks_run.fasta) |
— |
1. Hit Picking (with Barcodes / Plate Map)
- Primary Files Needed: One or more pooled, multiplexed sequencing runs (FASTQ or FASTA) derived from picked colonies or harvest plates.
- Accepted Formats: FASTQ (
.fastq,.fq,.fastq.gz,.fq.gz), FASTA (.fasta,.fa), or compressed.ziparchives. - Dual-Index Adapter Structure: Reads should contain terminal dual-index barcodes (i5 and i7) or demultiplexing adapter sequences matching Illumina TruSeq CD, Nextera XT, or custom in-house primers.
-
Plate Map Accessory File: An optional CSV, TSV, or Excel file (
.csv,.tsv,.xlsx) linking wells to clone identities. Supported geometries:- 2D Grid Matrix: An \(8 \times 12\) matrix for 96-well plates with rows labeled A–H and columns 1–12 containing clone names in cells.
- 3-Column Tabular Well List: A list containing
Well, Clone_Name, [Notes](e.g.A01, Clone_101, High_Affinity). - Custom Barcode Mapping: A table specifying custom primer indices per well (
Well, Clone_Name, i5_Sequence, i7_Sequence).
-
Auto-Detection Trigger: Uploading a plate map alongside sequence files, or sequencing archives where \(\ge 20\%\) of reads match standard dual-index kits.
2. Biopanning Enrichment Analysis (Longitudinal Multi-Round)
- Primary Files Needed: Two or more sequencing files, with each file representing a discrete selection round or panning cycle (e.g. Round 1, Round 2, Round 3).
- Accepted Formats: FASTQ (
.fastq,.fq,.fastq.gz), FASTA (.fasta,.fa), or a multi-file.ziparchive containing all round files. -
File Naming Conventions: Filenames must contain clear round identifiers so AbLead can order them chronologically:
- Standard Round Tokens:
Round1.fastq.gz,Round2.fastq.gz,Round3.fastq.gz - Abbreviated Tokens:
R1.fastq.gz,R2.fastq.gz,R3.fastq.gz(orR01,R02,R03) - Cycle Tokens:
panning_cycle_1.fq,panning_cycle_2.fq,panning_cycle_3.fq
- Standard Round Tokens:
-
Auto-Detection Trigger: Uploading \(\ge 2\) sequencing files containing matching round tokens (
round,panning,cycle, orr0*[1-9]).
3. Cross-Reactivity & Specificity Screening (Target vs. Counter/Cyno)
- Primary Files Needed: Exactly two sequencing files (or two distinct subsets of files) representing parallel selection against the primary target versus a counter-screen, decoy, or animal ortholog.
- Accepted Formats: FASTQ (
.fastq,.fq,.fastq.gz), FASTA (.fasta,.fa), or a.ziparchive containing both condition files. -
File Naming Conventions:
- Condition A (On-Target / Primary): Filename containing
human,hu,target,positive,pos,wt, orprimary(e.g.,anti_egfr_human_target.fastq.gz). - Condition B (Counter-Screen / Ortholog / Off-Target): Filename containing
cyno,cynomolgus,counter,negative,neg,mouse,ms,mock, ordecoy(e.g.,anti_egfr_cyno_counter.fastq.gz).
- Condition A (On-Target / Primary): Filename containing
-
Auto-Detection Trigger: Presence of parallel condition keywords (
cyno,human_vs,mouse_vs,counter_screen,off_target,cross_react, ortarget+counter).
4. Deep Mutational Scanning (DMS) & Site-Saturation Mutagenesis
Deep Mutational Scanning data can be provided to AbLead through two flexible routes. Researchers do not need to build complex DMS matrix files from scratch; AbLead can compute the entire fitness landscape directly from raw sequencing reads:
-
Route A: Direct from Sequencer (Raw FASTQ / FASTA — Recommended): Upload the two raw sequencing output files from your selection experiment:
- Pre-Selection Input Library File: Filename containing
input,naive,pre,baseline, orunselected(e.g.trastuzumab_dms_input.fastq.gz). - Post-Selection Binders File: Filename containing
selected,bound,post_sel, oreluted(e.g.trastuzumab_dms_selected.fastq.gz).
AbLead automatically aligns reads against the parental sequence, tallies amino acid substitutions at each IMGT position, normalizes frequencies against total read depth, calculates \(\log_2(\text{Enrichment})\) fitness scores (\(S\)), and classifies variants as Tolerated (\(S \ge -0.5\)) or Deleterious.
- Pre-Selection Input Library File: Filename containing
-
Route B: Pre-Computed Tabular Variant Spreadsheet (CSV / TSV): If you already have evaluated fitness data or variant counts from an external pipeline (such as Enrich2 or custom scripts), you can upload a simple spreadsheet table:
- Required Columns:
Chain,Position,Parental,Mutant - Optional Columns:
Score(\(\log_2\text{FC}\) or fitness metric),IsSafe(True/FalseorSafe/Deleterious) -
Example (
dms_variants.csv):Chain,Position,Parental,Mutant,Score,IsSafe H,101,Y,A,1.4,True H,101,Y,D,-1.2,False H,102,D,E,0.8,True
- Required Columns:
-
Route C: Positional 2D Heatmap Grid (Excel .xlsx or CSV): AbLead also accepts standard \(20 \times N\) matrix grids exported from Excel where the header row lists positions with parental amino acids (
Pos,27Y,28S,29N,...), rows 1–20 list the 20 amino acids, and cells contain fitness scores orSafe/Deleteriousflags. -
Parental Sequence Identification: The parental template sequence must either:
- Be labeled with
Parent,Parental,Input, orBaselinein its FASTA/FASTQ defline (e.g.>Parental_Clone). - Or be the highest-abundance sequence in the pre-selection baseline input file.
- Be labeled with
-
Auto-Detection Trigger: Filenames containing
dms,saturation,mutational_scan, or concurrentinputandselectedfiles.
5. FACS Sort-Seq Multi-Gate Affinity & Stability Binning
- Primary Files Needed: Two to four sequencing files, each corresponding to an isolated cell sorting gate fraction collected via fluorescence-activated cell sorting (FACS).
- Accepted Formats: FASTQ (
.fastq,.fq,.fastq.gz), FASTA (.fasta,.fa), or a.ziparchive. -
File Naming Conventions: Filenames must specify the sorting gate tier:
- High Gate (Top Tier):
gate_high,gate4,bin_high,bin4,top, orbright(e.g.,sortseq_cd19_gate_high.fastq.gz). - Medium Gate (Mid Tier):
gate_med,gate3,bin_med,bin3, ormid(e.g.,sortseq_cd19_gate_med.fastq.gz). - Low Gate (Low Tier):
gate_low,gate2,bin_low,bin2, ordim(e.g.,sortseq_cd19_gate_low.fastq.gz). - Negative Gate (Zero / Background):
gate_neg,gate1,bin_neg,bin1,zero, orblank(e.g.,sortseq_cd19_gate_neg.fastq.gz).
- High Gate (Top Tier):
-
Auto-Detection Trigger: Filenames or sequence headers matching gate patterns (e.g.
gate_high,gate1,bin_med,gate_neg).
6. Single-Cell AIRR & 10x Genomics Repertoire Profiling
- Primary Files Needed: Single-cell B-cell receptor (BCR) immune repertoire contig annotations or barcode-tagged sequence tables.
-
Accepted Formats:
- 10x Genomics Cell Ranger Output:
filtered_contig_annotations.csv,filtered_contig.csv, orall_contig_annotations.csv. - AIRR Standard Repertoire TSV: Tab-delimited
airr_rearrangement.tsvcomplying with AIRR community standards. - FASTA / FASTQ with Cell Barcodes: Reads where the defline includes the 16-bp cell barcode (e.g.
>AAACCTGAGAAACCAT-1_contig_1_HC).
- 10x Genomics Cell Ranger Output:
-
Expected Column Headers (CSV/TSV):
- Cell Barcode:
barcodeorcell_id(e.g.,AAACCTGAGAAACCAT-1). - Contig Identifier:
contig_idorsequence_id. - Chain / Locus:
chainorlocus(IGHfor heavy chain;IGKorIGLfor light chain). - Sequence Field:
sequence,sequence_alignment,junction_aa, orcdr3.
- Cell Barcode:
-
Auto-Detection Trigger: Filenames or headers containing
filtered_contig,cell_id,barcode,10x,airr, orsingle_cell. -
Smart SHM Maturation Scoring (Honegger vs. CDRs): Somatic hypermutations (SHM) are partitioned into binding zone mutations (\(M_{\text{bind}}\)) versus framework alterations (\(M_{\text{FR}}\)) to compute a net maturation score (\(S_{\text{mat}} = M_{\text{bind}} - 1.5 \times M_{\text{FR}}\)) and classify candidates:
- Affinity-Matured Lead (\(M_{\text{bind}} \ge 2\) and \(M_{\text{FR}} \le 1\)): True affinity-matured binding loops with preserved, germline-like framework scaffolds.
- Framework Divergent (\(M_{\text{FR}} \ge 3\) or \(M_{\text{FR}} > M_{\text{bind}}\)): High framework mutation burden posing immunogenicity, stability, or developability liabilities.
- Germline-Like (\(M_{\text{bind}} \le 1\) and \(M_{\text{FR}} \le 1\)): Low-divergence or unmutated baseline B-cell contigs.
- Balanced Maturation: Moderate, balanced mutation profile.
-
Dynamic Dashboard & Import Selection: Researchers can select between Honegger Framework Exclusions (recommended, preserving structural Vernier and loop-adjacent framework positions defined by AbLead's humanization mask) and CDR Only (with choice of North [system default], IMGT, Kabat, Martin, or AHo region definitions). This can be pre-configured on the import form or toggled dynamically on the fly in the Single-Cell AIRR dashboard banner, instantly re-scoring candidates and updating category breakdown pills and table badges without re-uploading the file.
7. Synthetic & Pre-Selection Library Quality Control
- Primary Files Needed: Exactly one sequencing file representing the naive, unselected, or newly synthesized antibody library prior to biological panning.
- Accepted Formats: FASTQ (
.fastq,.fq,.fastq.gz) or FASTA (.fasta,.fa). -
File Naming Conventions: Filename must contain baseline library identifiers:
naive_synthetic_human_scfv.fastq.gzpre_panning_baseline_repertoire.fastqsynthetic_library_design_qc.fasta.gz
-
Auto-Detection Trigger: Single uploaded sequencing file containing
naive,synthetic,pre_panning,baseline_lib, ordesign_qc.
8. Hybridoma Paired Fv Recovery (Dual-Amplicon Separate Pools)
- Primary Files Needed: Two or more sequencing files (or a
.ziparchive) where Heavy (VH) and Light (VL) chain amplicons were amplified and sequenced in separate pools. - Accepted Formats: FASTQ (
.fastq,.fq,.fastq.gz), FASTA (.fasta,.fa), or compressed.ziparchives. -
File Naming Conventions: Filenames or headers must distinguish Heavy and Light chain amplicon pools:
- Heavy Chain Files:
_HC,_VH,Heavy, orIGH(e.g.,hybridoma_sample_01_HC.fastq.gzorplate1_vh.fq). - Light Chain Files:
_LC,_VL,Light,IGK, orIGL(e.g.,hybridoma_sample_01_LC.fastq.gzorplate1_vl.fq).
- Heavy Chain Files:
-
Optional Plate Map: Can be paired with a microplate map to cross-reference well coordinates across separate Heavy and Light amplification plates.
- Auto-Detection Trigger: Concurrent presence of both Heavy (
_HC/_VH/heavy) and Light (_LC/_VL/light) file or header tokens.
9. Hit Picking (No Barcodes)
- Primary Files Needed: One or more sequencing files from unbarcoded Sanger, PacBio, Oxford Nanopore, or Illumina colony screening.
- Accepted Formats: FASTQ (
.fastq,.fq,.fastq.gz), FASTA (.fasta,.fa), GenBank, EMBL, or raw plain-text sequences. - Auto-Detection Trigger: Default fallback when no plate maps, barcode kits, longitudinal rounds, or specialized screening tokens are detected.
Plate Map Ingestion & Dual-Index Barcode Demultiplexing
For hybridoma sequencing campaigns, single-cell screening, and multi-well binder selection plates, researchers can upload an optional plate map to demultiplex pooled sequencing libraries, trace reads back to designated wells, and link phenotypic assay data directly to antibody genotype sequences.
Plate Map Ingestion & Barcode Kit Options
- Flexible Geometries: Upload plate maps of any geometry (e.g. 24-, 48-, or 96-well grid matrices, or 3-column tabular well lists
Well, Clone_Name, [Notes]) in CSV or TSV format. -
Supported Index Barcode Kits:
- Illumina CD (Default): Illumina TruSeq / Nextera CD dual-indexes: D501–D508 (i5, rows A–H) \(\times\) D701–D712 (i7, columns 1–12) with precomputed reverse complements.
- Nextera XT: Illumina Nextera XT dual-indexes: S501–S508 (i5, rows A–H) \(\times\) N701–N712 (i7, columns 1–12).
- In-Map Auto-Detect: Automatically detects custom barcode columns in the plate map (e.g.
Well, Clone_Name, i5_Sequence, i7_Sequenceori5, i7), generating on-the-fly dynamic barcode dictionaries with reverse complements to accommodate in-house primers without manual configuration.
-
Automatic Barcode & Plate Detection (No Plate Map Required): When sequencing archives are uploaded without an accompanying plate map layout, the demultiplexing engine automatically samples reads for dual-index barcodes (i5/i7). If standard adapter barcodes are recognized in \(\ge 20\%\) of reads, AbLead automatically instantiates a default coordinate plate grid (
A01throughH12) and initiates microplate demultiplexing. -
Dual-Amplicon Paired Fv Resolution & Single-Amplicon scFv Priority: For campaigns where Heavy (VH) and Light (VL) chain amplicons were amplified and sequenced in separate pools across the same plate well coordinates (such as Row A–D VH files and Row A–D VL files), or when Paired Fv is explicitly selected, AbLead tallies Heavy and Light chains independently per physical well. The dominant Light chain and dominant Heavy chain for each well are paired into a unified Fv clone (
format: "fv"), strictly displaying the Light chain before the Heavy chain and annotating CDRs for both chains.Importantly, whenever full-length scFv amplicons encoding both VH and VL on the same read are detected in a well, bona fide scFv reads take priority over trace single-domain fragmentation noise. Wells dominated by intact scFv amplicons are classified as
format: "scfv", ensuring sequencing noise or degraded reads never misclassify an scFv well as a dual-amplicon paired Fv. -
Dynamic Background Noise & Index-Hopping Cutoff: Illumina optical bleed and index hopping routinely cause 0.5%–2% of reads from active wells to misassign into unused barcode combinations. AbLead automatically computes a dynamic read depth floor scaled to 3% of the target sequencing depth (with a 10-read floor). In auto-detected plate grids, uninoculated wells receiving only 1–5 stray reads are excluded from candidate clone outputs to eliminate phantom clones, while remaining fully visible on the microplate heatmap for complete spatial coverage.
-
Robust Demultiplexing: Scans 5' and 3' terminal windows across forward and reverse orientations with 1-bp mismatch tolerance, dynamic barcode length detection (6, 8, 10, or 12 bp), and fallback to filename/header index tokens.
- Dominant Well Clone Consensus: Sequences within each designated well are grouped and translated to determine the dominant consensus antibody clone, eliminating synonymous PCR variants and sequencing errors while tracking within-well percentage abundance (
% of well). - Cross-Well Duplicate Tracking & Deduplication: When identical antibody protein sequences appear across multiple designated wells, they are flagged with amber
Shared Seqbadges. When cross-well deduplication is active (either during ingestion via Cross-Well Clonal Deduplication or dynamically via the results dashboard toggle), duplicate wells are collapsed into the highest-depth primary well (-count), combining total read counts while preserving companion wells as collapsed aliases (collapsed_wells). In Well Preservation mode, each well is displayed individually with its own physical well coordinate and clone name.
Pre-Flight Plate Map Validation & Pre-Import Warning Modal
Spreadsheet applications (such as Microsoft Excel or Apple Numbers) often introduce silent formatting artifacts when exporting plate maps to CSV, such as blank lines containing only trailing commas (,,,,,,,,,,,,), or users may inadvertently assign duplicate barcodes or select an index kit mismatch. Left unchecked, such anomalies can cause plate map parsing to fail or misalign coordinate grids, wasting time and compute on multi-gigabyte uploads.
To catch these issues proactively, AbLead performs instant pre-flight validation on the plate map before initiating large sequencing file uploads or streaming pipeline jobs:
-
Pre-Flight Inspection Checks:
- Leading Blank Rows / Delimiter Lines: Detects leading empty lines or delimiter-only rows (e.g.
,,,,,,,,,,,,) created by spreadsheet exports that misalign row offsets and prevent 2D plate grids from parsing. - Zero Designated Wells: Alerts immediately if the plate map cannot be resolved into either a 2D matrix or a 3-column well table format, preventing silent demultiplexing failures.
- Duplicate Barcode Assignments: Verifies that i5 (row) and i7 (column) barcodes are unique across rows and columns, catching accidental duplicate primer entries.
- Barcode Kit Mismatches: Checks header labels and barcode tokens against the selected index kit (e.g. Illumina CD vs. Nextera XT), highlighting nomenclature discrepancies (such as D501 vs. S501).
- Leading Blank Rows / Delimiter Lines: Detects leading empty lines or delimiter-only rows (e.g.
-
Interactive Pre-Import Warning Modal: When warnings or structural anomalies are detected, form submission is intercepted and presented in an interactive warning modal detailing each issue with color-coded severity badges:
- Auto-Trim Blank Rows & Proceed: If leading delimiter-only lines are detected, clicking this action automatically instructs the server to strip leading empty rows and immediately proceeds with library evaluation—no manual file editing or re-upload required.
- Cancel & Fix File: Closes the dialog and aborts the upload, allowing researchers to correct the plate map in their local spreadsheet editor before transferring large sequencing datasets.
- Proceed As-Is: Allows researchers to intentionally bypass non-fatal warnings if custom plate conventions or non-standard configurations are expected.
Server-Side Demultiplexing Ingestion Guardrails
In addition to pre-flight inspection, the server-side evaluation pipeline enforces strict guardrails during ingestion:
-
Explicit Zero-Well Parse Guardrail: If an uploaded plate map parses 0 physical wells, the pipeline halts immediately with an explicit error detailing the parse failure, preventing the system from silently discarding the plate map and running unlinked, flat sequence evaluations.
-
Zero-Match Read Depth Guardrail: If a plate map is successfully parsed but 0% of sequencing reads match any of the designated well barcodes, the pipeline halts with a diagnostic error informing the user that no reads could be assigned to plate barcodes (suggesting verification of index kit selection, primer read orientations, or barcode length configuration).
-
Quality-Weighted Clonal Consensus Selection: When resolving the dominant antibody sequence in a designated well, AbLead evaluates candidate sequence quality:
- Candidates with Valid status are prioritized over candidates with Warning status.
- A Warning candidate (e.g. carrying an N-terminal framework anomaly or potential sequencing artifact) must exhibit overwhelming read dominance (\(\ge 5\times\) the read volume of the highest Valid sequence) to override a clean candidate. This prevents low-frequency indel slippages or PCR errors from dominating high-depth wells over authentic clones.
-
Consensus Dominance & Indeterminate Well Detection:
- Low Consensus Dominance: Wells with \(\ge 30\) sequencing reads where the top sequence has \(<5\) reads or represents \(<10\%\) of total well reads are flagged with a
Low consensus dominancewarning badge and downgraded toWarningstatus. - Indeterminate Clones: Wells with \(\ge 50\) reads where the top sequence represents \(<5\%\) of well reads are flagged as
Indeterminate clone: well lacks a dominant consensus sequence.
- Low Consensus Dominance: Wells with \(\ge 30\) sequencing reads where the top sequence has \(<5\) reads or represents \(<10\%\) of total well reads are flagged with a
-
Nanopore / Error-Tolerant Intra-Well Consensus (abPOA): When working with long-read sequencing technologies such as Oxford Nanopore (ONT), single-molecule raw reads often exhibit stochastic \(1\text{-bp}\) insertions and deletions (indels) in homopolymer stretches. These artifacts cause individual raw reads to shift out of frame, triggering spurious stop codons or broken structural anchors in standard exact-matching pipelines. Enabling Nanopore / Error-Tolerant Consensus (abPOA) activates an intra-well Partial Order Alignment engine:
- SIMD-Accelerated Multiple Sequence Alignment: Within each designated well bin, candidate amplicon reads (\(\ge 3\) reads) are rapidly aligned into an alignment graph using
pyabpoa(\(<15\text{ ms}\) per well). - Stochastic Indel Elimination: Random single-molecule homopolymer wobble cancels out through majority voting across the read depth, restoring authentic open reading frames (\(Q35+\) consensus accuracy) without heuristic sequence tampering.
- Dual Amplicon & Multi-Clone Resolution: Supports up to two distinct consensus trajectories per well, cleanly resolving separate Heavy and Light chains in paired Fv libraries or distinguishing bi-clonal wells.
- Visual abPOA Badges: Clones resolved via Partial Order Alignment display a dedicated indigo
abPOAbadge directly beside the clone name in the candidate table, with consensus read depths recorded in clone metrics.
- SIMD-Accelerated Multiple Sequence Alignment: Within each designated well bin, candidate amplicon reads (\(\ge 3\) reads) are rapidly aligned into an alignment graph using
Interactive 96-Well Read Depth Plate Heatmap
When a plate map is provided, the physical 96-well microplate read depth heatmap is automatically displayed at the top of the Visual Analytics Dashboard:
- Non-Linear Gradient Scaling: Uses square-root color gradient scaling (
rgba(30, 58, 138, alpha)) to balance visual contrast across wide sequencing dynamic ranges (from single reads to tens of thousands of reads), preventing dominant wells from visually washing out lower-abundance binders. - Plate Summary Metrics: A summary bar highlights the Max Read Depth, Median Read Depth, and Min Read Depth across physical designated wells.
- Empty Well Distinction: Unassigned or empty wells are cleanly differentiated with muted dashed borders and gray backgrounds.
- Hover Inspection: Hovering over any well displays an instant tooltip detailing its physical coordinates (e.g.
B04), assigned dominant clone name, sequencing read depth, and within-well percentage frequency (% of well). - Inline Header Well Inspection: Clicking any well cell highlights the active well with an amber focus border and displays its physical coordinates, assigned clone name, sequencing read depth, within-well percentage frequency (
% of well), and validation status badge directly on a dedicated line in the heatmap card header without modifying or restricting table search filters. Clicking the well again, clicking the dismiss (✕) button, or pressingEscapeclears the selection cleanly.
Real-Time 4-Stage Pipeline Tracker
Large sequencing datasets (tens of thousands of reads) are processed through a multi-stage streaming pipeline with live feedback:
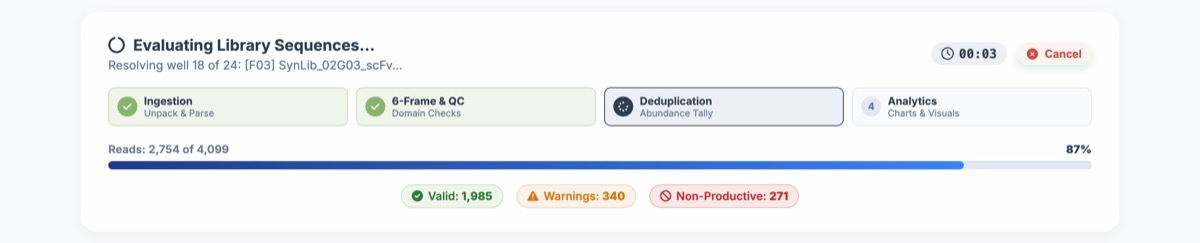
Pipeline Stages
- Ingestion & Decompression: Unpacks
.zipor.gzarchives, parses headers, sequences, and quality scores, and identifies paired-read groupings. - 6-Frame Translation, In-Frame Nucleotide Extraction & IMGT QC: Evaluates reading frames, identifies variable domain boundaries, extracts clean in-frame coding nucleotide sequences (Frame 1) for each domain, validates 7-region framework boundaries, and verifies structural cysteines.
- Clonal Deduplication & Abundance: Collapses identical translated protein sequences into unique clones and calculates read abundance counts and population frequencies.
- Analytics & Visualization: Generates read length distributions, quality control breakdowns, clonal abundance rankings, and CDR3 loop length profiles.
Live Progress Controls
- Reads Counter & Progress Bar: Real-time numerical display (
Reads: X of Y) paired with a smooth gradient progress bar and percentage indicator. - Dynamic QC Tally Badges: Live updating badges display the real-time tally of
Valid,Warnings, andNon-Productivereads as evaluation proceeds. - Active Elapsed Timer: Stopwatch timer displays elapsed evaluation time (
MM:SS). - Instant Cancellation: Clicking Cancel uses
AbortControllerto cleanly terminate the streaming evaluation and restore the upload form without hanging server resources.
Evaluation Results Dashboard
Upon completion of the evaluation pipeline, AbLead presents the complete Library Evaluation Results Dashboard. This unified workspace displays summary quality counters, demultiplexing metrics, interactive analytical charts, an AIRR-compliant Clonal Clade Tree, an interactive 2D Sequence Space Landscape (UMAP / MDS), and an actionable candidate selection table.
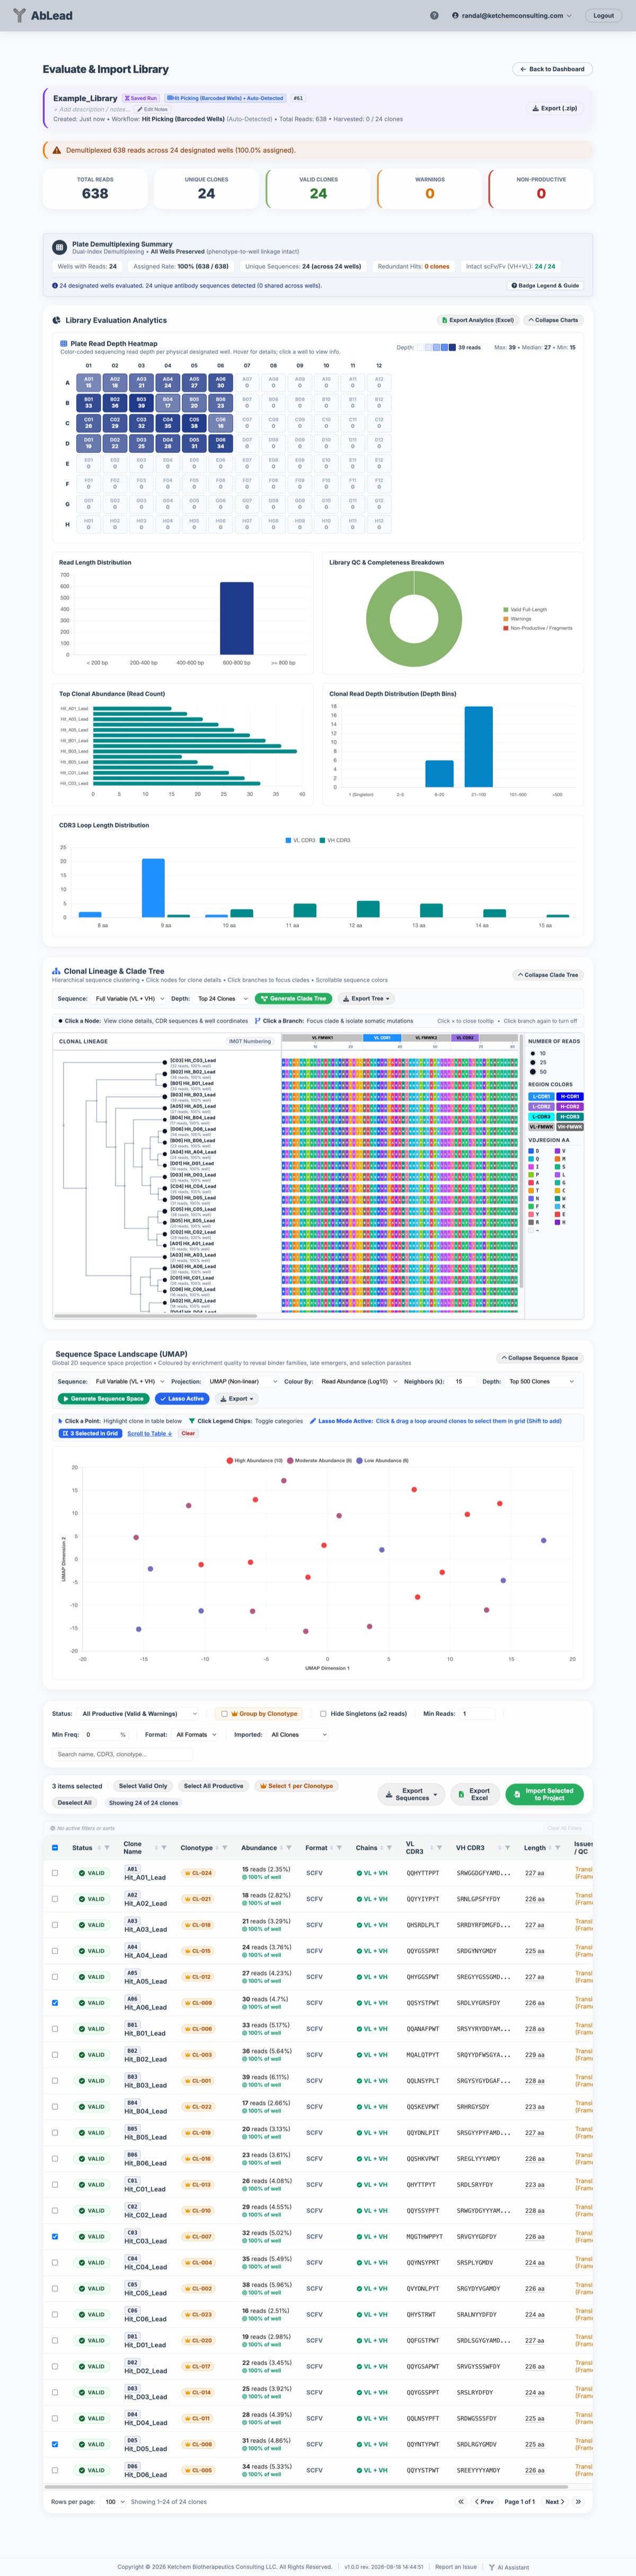
Active Library Summary Banner & Workflow Badging
At the top of the evaluation results workspace, the active library banner displays the library name, run ID, and high-level run metadata:
-
Workflow Badge: A prominent color-coded badge reports the active analysis workflow:
- Hit Picking (Barcoded Wells) (Royal Blue, grid icon
fa-th). - Biopanning Kinetics (Emerald Green, line-chart icon
fa-chart-line). - Cross-Reactivity Screening (Teal, crosshairs icon
fa-crosshairs). - Deep Mutational Scanning (DMS) (Indigo, matrix icon
fa-th-large). - FACS Sort-Seq Bins (Cyan, filter icon
fa-filter). - Single-Cell AIRR Repertoire (Violet, cell icon
fa-users). - Synthetic Library QC (Amber, check-double icon
fa-check-double). - Hybridoma Paired Fv (Purple, link icon
fa-link). - Hit Picking (Direct Clones) (Slate Blue, DNA icon
fa-dna).
- Hit Picking (Barcoded Wells) (Royal Blue, grid icon
-
Auto-Detection Feedback: When Auto-Detect Workflow was selected during import, both the badge and the metadata details line explicitly indicate that the workflow was automatically resolved from dataset structure:
- Badge:
Hit Picking (Barcoded Wells) • Auto-Detected(with descriptive hover tooltip). - Metadata Subtitle:
Created: [Date] • Workflow: Hit Picking (Barcoded Wells) (Auto-Detected) • Total Reads: X • Harvested: Y / Z clones.
- Badge:
-
Plate Demultiplexing Summary Badges: When evaluating barcoded plates, the demultiplexing banner highlights key spatial metrics:
- Intact scFv/Fv (VH+VL): Total designated wells where both Light and Heavy variable domains were successfully recovered and paired into a complete Fv antibody.
- Redundant Hits: Total designated wells sharing identical full-length antibody protein sequences across multiple physical wells.
The sections below detail each component of the evaluation results, including structural QC criteria, clonal clustering, biopanning enrichment kinetics, interactive filtering, visual analytics, and candidate harvesting into downstream projects.
Strict Domain Completeness & Structural QC
To prevent fragmented, out-of-frame, or structurally unviable sequences from polluting project campaigns, every sequence undergoes rigorous domain verification:
1. 7-Region IMGT Boundary Verification
Every variable domain must contain all seven canonical IMGT regions in contiguous order:
FMWK1 - CDR1 - FMWK2 - CDR2 - FMWK3 - CDR3 - FMWK4
Reads missing any framework or CDR region (such as truncated fragments or aborted primer-dimers) are categorized as Non-Productive.
2. Canonical Structural Cysteines
- Cys23 (FMWK1) and Cys104 (FMWK3) form the essential intrachain disulfide bond required for the immunoglobulin fold.
- Sequences lacking either cysteine are flagged with warnings or categorized as non-productive depending on domain completeness.
3. Framework 1 Structural Integrity, Frameshift Elimination & Indel Protection
Profile Hidden Markov Models (HMMs) can occasionally force-align non-antibody sequences or out-of-frame translations into Framework 1 when downstream regions are intact. AbLead guards against this with strict structural validation:
-
Heavy Chain Canonical N-Terminus: IMGT Position 1 must be Glutamate (E), Glutamine (Q), or Aspartate (D). Residues that disrupt heavy chain N-terminal folding geometry (such as W, C, or P) are strictly rejected as defective.
-
Core Hydrophobic \(\beta\)-Strand A Validation: IMGT Position 4 forms an invariant hydrophobic core \(\beta\)-strand element (typically Leucine L or Valine V). Sequences with disruptive or charged residues characteristic of out-of-frame translational chimeras (such as W, R, P, C, K, H, E, D, or S) fail domain completeness and are categorized as Non-Productive.
-
Light Chain N-Terminus & Core Validation: Light chain IMGT Position 1 must be Aspartate (D), Glutamate (E), Alanine (A), Serine (S), Asparagine (N), Glutamine (Q), Isoleucine (I), or Valine (V), with W and C strictly disallowed. Core Position 4 disallows W, R, C, or K.
-
Out-of-Frame Chimera Elimination vs. In-Frame Engineering: Sequencing indel slippages (such as homopolymer poly-G tract additions or deletions at cloning junctions) often shift translation into an alternate reading frame. If the alternate frame lacks stop codons downstream of the indel, naïve HMM aligners can force an aberrant out-of-frame peptide (e.g.
RSSWWSL...orWLRSSWW...) into Framework 1. AbLead's dual-tier validation automatically catches and rejects these chimeric artifacts as Non-Productive, while preserving genuine in-frame engineered variants (such as tandem N-terminal insertions where position 1 isLand core position 4 isL) as Warning clones without failing completeness. -
Translation Frame Selection Safeguard: During multi-frame translation of raw nucleotide reads (
find_best_domain_translation), candidate reading frames are tested against full domain completeness and structural viability. Aberrant out-of-frame chimeras are prevented from being selected as the optimal translation frame.
4. Full-Length scFv Domain Pairing
For scFv constructs, both a heavy chain (VH) and light chain (VL) variable domain must be present with an intact linker (typically 10–40 amino acids). Reads containing only a single domain within a full-length amplicon are flagged as truncated fragments rather than misclassified as VHH nanobodies.
-
Structural Framework & CDR Integrity: Candidate qualification verifies full-length IMGT framework (FR1–FR4) and CDR (CDR1–CDR3) completeness via AntPack rather than applying arbitrary length cutoffs. Reads exceeding primer-dimer lengths (\(\ge 150\text{ bp}\)) are structurally aligned and validated.
-
Standardized Variable Domain Length: In the candidate selection table and exports, scFv sequence lengths report the combined functional variable domain length (\(\text{VL} + \text{VH}\), e.g. 233 aa), establishing direct 1:1 parity with downstream AbLead project developability grids. For constructs containing linkers or expression tags, an interactive hover tooltip details the full translated amplicon length along with detected linker sequence and length (e.g.
Variable domains: 233 aa, Full amplicon: 289 aa (25 aa linker)). -
Consensus Demultiplexing Priority: When resolving dominant clones in barcoded wells, intact scFv amplicons take precedence over stray single-chain fragments. Wells dominated by complete scFv reads are classified as
scfv, preventing trace degradation products or sequencer errors from inadvertently triggering dual-amplicon paired Fv calls.
5. VHH (Single-Domain / Camelid Nanobody) Architecture
Single heavy chain variable domains (VHH nanobodies) are natively supported across the entire pipeline:
-
Architecture & Length Verification: Variable domains are evaluated for complete IMGT framework (FR1–FR4) and CDR boundaries with an intact canonical Cys23–Cys104 disulfide bond. Amplicons \(\ge 200\) bp are retained while excluding primer dimers (< 200 bp).
-
Single-Chain Well Resolution: In microplate demultiplexing, wells containing single heavy domains resolve their dominant VHH sequence without requiring or expecting a Light chain partner.
-
AIRR Lineage Grouping: VHH clones cluster into somatic clonal families based on exact VHH CDR3 loop length and \(\ge 85\%\) amino acid identity.
-
Downstream Project Integration: When harvested into an AbLead project, single-domain antibodies seamlessly transition into downstream developability:
-
PLAbDab: Queries the specialized VHH / VNAR single-domain patent and literature database.
-
Humanization & Germline Alignment: Accounts for hallmark camelid framework residues at IMGT positions 42, 49, 50, and 52 during human germline homology matching.
-
OASign Humanness & Liabilities: Evaluates biophysical liabilities and humanness scoring specifically on the single heavy variable domain.
-
6. Phage Display Amber Codon Suppression (TAG → Q)
In phage display selection campaigns propagated in supE amber suppressor E. coli host strains (such as TG1 or XL1-Blue), in-frame amber stop codons (TAG) are biologically translated into Glutamine (Q):
-
Amber Suppression Toggle: Researchers can check Suppress Amber Stop Codons (TAG → Q) in the library evaluation form.
-
Full-Length Translation Fidelity: When enabled, in-frame
TAGcodons within variable domains are translated cleanly as Glutamine (Q), preventing functional phage display clones from being prematurely truncated or misclassified as non-productive. -
Transparent Sequence Annotation: Suppressed clones evaluate as Valid and receive an informative warning badge (
Amber stop codon suppressed (TAG translated as Q)), ensuring researchers can easily identify clones with engineered or native amber codons for downstream mammalian expression re-cloning.
Clonal Lineage Clustering (Clonotyping) & Dominant Lead Selection
In high-diversity antibody libraries and immune repertoires, related somatic hypermutation variants and PCR amplification artifacts can inflate candidate diversity. AbLead implements high-throughput clonal family clustering adhering to AIRR Community standards to group variants into biological lineages and identify dominant lead candidates:
Clonal Partitioning & Hamming Clustering
- AIRR Structural Definition: Clones are partitioned by antibody format and exact CDR3 length signatures (
(len(light_cdr3), len(heavy_cdr3))), ensuring Light chain CDR3 length is checked strictly before Heavy chain CDR3. - Hamming Identity Threshold: Within each exact length partition, single-linkage clustering connects clones whose CDR3 sequences share \(\ge 85\%\) amino acid identity (Hamming distance).
- Dominant Lead Identification: Within each clonal family, the candidate with the highest sequencing read abundance is automatically designated as the Dominant Lead (
is_clonotype_lead). -
Visual Lineage Badging:
- Dominant Lead: Highlighted with a gold crown badge (e.g.
CLONO_0001) with tooltip showing the total family size. - Somatic Variants: Tagged with a muted branch badge (e.g.
CLONO_0001) linking directly back to the dominant lead's name and read count.
- Dominant Lead: Highlighted with a gold crown badge (e.g.
1-Click Lead Selection & Lineage Filtering
- Group by Clonotype: Toggling the Group by Clonotype checkbox in the filter toolbar collapses the candidate table to display only the dominant lead of each family, instantly condensing thousands of somatic variants into distinct clonal lineages.
- Select 1 per Clonotype: The bulk action bar features a dedicated Select 1 per Clonotype button that selects the top dominant lead from every visible clonal family with a single click, preventing redundant variant harvesting while preserving diversity for downstream developability.
Biopanning Enrichment Kinetics & Trajectory Analytics
When libraries are screened across iterative selection rounds (such as Phage, Yeast, Ribosome, or Mammalian Display biopanning campaigns), candidate tracking across successive rounds is essential to distinguish bona fide on-target binders from non-specific background binders. AbLead automatically recognizes longitudinal sequencing archives (e.g., Round1.fastq.gz, Round2.fastq.gz, Round3.fastq.gz or R1.fq, R2.fq, R3.fq) to track round-by-round enrichment kinetics:
Bayesian-Smoothed Enrichment Scoring
-
Normalized Frequency Tracking: For each round \(r\), candidate read counts are normalized against total round depth:
\[f_r = \frac{C_r}{N_r} \times 100\%\] -
Bayesian Laplace Smoothing: To prevent division-by-zero or extreme fold-change artifacts when a rare clone was absent or observed at a single read in early rounds, AbLead applies a Laplace pseudo-count (\(\epsilon = 0.5\) reads):
\[\text{FC} = \frac{(C_{\text{final}} + \epsilon) / N_{\text{final}}}{(C_{\text{initial}} + \epsilon) / N_{\text{initial}}}\] -
Log2 Fold Change:
\[\log_2(\text{FC}) = \log_2\left(\frac{(C_{\text{final}} + \epsilon) / N_{\text{final}}}{(C_{\text{initial}} + \epsilon) / N_{\text{initial}}}\right)\]
Negative Control Demultiplexing & Target Specificity Screening
Sequencing files representing negative control, mock, decoy, or bead counter-selection runs (e.g. Negative_Control.fastq, Decoy_beads.fastq, Mock_cells.fasta, or files containing neg, mock, decoy, or bead) are automatically demultiplexed and evaluated alongside chronological panning rounds:
-
Laplace-Smoothed Specificity Ratio: Computes an on-target versus negative control enrichment ratio (\(R_{\text{spec}}\)):
\[R_{\text{spec}} = \frac{(C_{\text{target}} + \epsilon) / N_{\text{target}}}{(C_{\text{neg}} + \epsilon) / N_{\text{neg}}}\] -
Antigen Specificity Qualification: Candidates achieving \(R_{\text{spec}} \ge 3.0\) are classified as
Antigen-Specific. Candidates exhibiting \(R_{\text{spec}} < 3.0\) or showing prominent accumulation in negative control selections are flagged asNon-Specific(Matrix Binders).
Kinetic Trajectory Classifications
Each clone is categorized into one of six kinetic trajectory behavior classes based on multi-round frequency progression and negative control specificity:
- Stable Binder (Emerald badge,
+X.Xx): Clones demonstrating consistent, monotonic frequency amplification across successive selection rounds on target (\(R_1 \to R_2 \to R_3\), \(\text{FC} \ge 2.0\), \(R_{\text{spec}} \ge 3.0\)). - Rescuer (Lime badge): Late-surging candidates displaying explosive clonal expansion in later selection cycles (\(R_{\text{final}} / R_{\text{mid}} \ge 3.0\)) despite low or undetectable abundance in early rounds.
- Selection Artifact (Amber badge): Clones exhibiting a transient mid-campaign frequency spike followed by rapid collapse or depletion in later rounds (characteristic of transient expression advantages or PCR over-amplification).
- Weak Binder (Slate badge): Clones exhibiting modest or plateauing frequency across selection cycles (\(1.0 \le \text{FC} < 2.0\)).
- Depleting (Crimson badge): Clones whose population frequency progressively declines across selection rounds (\(\text{FC} \le 0.5\)).
- Non-Specific Binder (Rose badge): Clones accumulating heavily in negative control, mock, or bead selections (\(R_{\text{spec}} < 3.0\) or negative control frequency \(\ge\) target rounds).
Interactive Enrichment Visualizations & Filtering
- Panning Kinetics Trajectory Chart: In multi-round campaigns, an interactive multi-line chart dynamically plots candidate library frequency percentages across selection rounds (\(R_1 \to R_2 \to R_3 \dots\)) for top enriched leads. Hover tooltips report the exact round frequency percentage, providing direct visual confirmation of candidate amplification kinetics.
- Trajectory Badges & Visual Tooltips: The candidate table displays color-coded trajectory pill badges (e.g.
Stable Binder: 11.29x (+3.50),Rescuer: 116.06x (+6.86),Selection Artifact: 0.30x (-1.76),Non-Specific: 0.36x (-1.47)), with hover tooltips detailing round-by-round frequency breakdowns. - Min Fold Change Filter: A dedicated Min Fold Change numerical filter appears in the toolbar, enabling researchers to filter for clones exhibiting \(\ge 2\text{x}\), \(\ge 5\text{x}\), or \(\ge 10\text{x}\) fold enrichment.
- Enrichment Column: The table displays fold change and \(\log_2(\text{FC})\) with hover tooltips detailing the round-by-round frequency breakdown (e.g.
R1: 0.05% → R2: 0.32% → R3: 1.84%).
Fast PTM Liability Screening & Developability Triage
Early-stage developability assessment directly within discovery repertoires eliminates clones harboring chemical instabilities, aggregation-prone motifs, or post-translational modification (PTM) liabilities before committing resources to recombinant expression, purification, and downstream biophysical characterization. AbLead incorporates a rapid, high-throughput sequence scanner that screens every productive variable domain and CDR loop against canonical biophysical liability motifs.
Dual-Scope Scanning Engine
The liability scanner partitions sequence motifs into two distinct structural scopes:
-
Variable Domain Scope: Scanned across the full-length variable domain (evaluating Light chain strictly before Heavy chain):
- N-Linked Glycosylation (
N[^P][ST]): Canonical consensus sequon for post-translational N-glycosylation. Can introduce bulky glycan heterogeneity, sterically obstruct paratope interactions, or trigger immunogenicity. - Unusual / Unpaired Cysteines (\(C \ne 2\) in variable domains \(\ge 80\) aa): Intact antibody variable domains require exactly two structural cysteines (Cys23 in FR1 and Cys104 in FR3) to establish the conserved intradomain immunoglobulin fold disulfide bridge. Extra or missing cysteines indicate reactive free sulfhydryls prone to covalent disulfide scrambling, covalent homodimerization, or misfolding.
- N-Linked Glycosylation (
-
CDR Paratope Scope: Evaluated specifically within complementarity-determining regions (CDR1, CDR2, CDR3):
- High-Risk Asparagine Deamidation (
NG,NS): Spontaneous deamidation proceeding rapidly at neutral and basic pH via cyclic succinimide intermediates, leading to charge heterogeneity and frequent loss of antigen-binding affinity. - Medium-Risk Asparagine Deamidation (
NA,NH,NN,NT): Intermediate-rate deamidation motifs. - Low-Risk Asparagine Deamidation (
SN,TN,KN): Slow, conformationally constrained deamidation motifs. - Aspartate Isomerization (
DD,DG,DH,DS,DT): Spontaneous isomerization of Asp into isoaspartate via succinimide intermediates, altering CDR backbone conformation. - Peptide Fragmentation (
DP): Acid-sensitive Asp-Pro peptide bonds vulnerable to backbone cleavage during low-pH viral inactivation or protein A elution steps. - Peptide Fragmentation (
TS): Cleavage vulnerability at Thr-Ser motifs. - Acid Hydrolysis (
NP): Asn-Pro peptide bonds susceptible to spontaneous hydrolysis under mildly acidic conditions. - Methionine Oxidation (
M): Solvent-accessible methionines prone to oxidation by reactive oxygen species (ROS), yielding methionine sulfoxide and promoting hydrophobic patch aggregation. - Tryptophan Oxidation (
W): Aromatic oxidation and photo-oxidation of Trp indole rings, often causing coloration, aggregation, or loss of binding.
- High-Risk Asparagine Deamidation (
PTM Risk Tiers & Triage Classifications
Each productive candidate is classified into one of three standardized developability risk tiers based on motif severity and burden:
- Clean (Emerald badge): 0 detected PTM liabilities across variable domains and CDR loops. Preferred for immediate downstream lead harvesting.
- Moderate (Amber badge): Single high-risk liability motif or multiple medium/low liabilities (e.g. single Met/Trp oxidation or moderate deamidation).
- High (Red badge): \(\ge 2\) high-risk liability motifs (e.g. unpaired cysteines, N-linked glycosylation, or high-risk deamidation). Candidates should be deprioritized or flagged for engineering.
Interactive Grid Display & Multi-Select Filtering
- PTM Risk Column: The Candidate Evaluation Table features a dedicated PTM Risk column displaying color-coded badges (
Clean,Moderate,High). - Detailed Motif Tooltips: Hovering over any PTM Risk badge reveals a full diagnostic breakdown detailing detected motifs, affected chains, and regional scopes (e.g.
H: Deamidation (High) (CDR) (x1)orL: N-glycosylation (x1)). - Multi-Select Column Filtering: The column filter popover enables isolating candidates by one or more risk tiers (e.g. filtering for
CleanandModerateleads while excludingHigh).
Extended Screening & Engineering Workflows
In addition to standard biopanning and barcoded hit picking, AbLead provides dedicated calculation engines, interactive visual analytics, and export sheets for 5 advanced antibody discovery and engineering modalities:
1. Cross-Reactivity & Specificity Screening (Target vs. Counter/Cyno)
Parallel selection campaigns evaluate antibody binding against primary therapeutic targets in parallel with counter-targets, decoys, or orthologs (e.g., Human vs. Cynomolgus monkey for preclinical cross-reactivity, or on-target vs. homologous off-target proteins to assess specificity).
- Condition Partitioning: Sequence files are automatically partitioned into Condition A (Target/Human, \(N_A\) reads) and Condition B (Counter/Cyno, \(N_B\) reads).
-
Laplace-Smoothed Specificity Index: To handle clones unobserved in the counter-screen without division-by-zero, AbLead computes a Bayesian smoothed specificity ratio (\(\epsilon = 0.5\)):
\[R = \frac{(C_A + \epsilon) / N_A}{(C_B + \epsilon) / N_B}\] -
Log2 Ratio:
\[\log_2(R) = \log_2(R)\] -
Specificity Classifications:
- Target-Specific (Emerald badge, \(C_A \ge 2\) and \(R > 5.0\)): Selective on-target enrichment with minimal counter-target binding.
- Cross-Reactive (Blue badge, \(C_A \ge 2\), \(C_B \ge 2\), and \(0.2 \le R \le 5.0\)): Balanced dual-species binding desirable for preclinical cynomolgus monkey translational models.
- Counter-Enriched (Amber badge, \(C_B \ge 2\) and \(R < 0.2\)): Off-target or counter-selective binders.
- Low Abundance (Slate badge): Rare candidates with sub-threshold sampling.
-
Interactive 2D Specificity Scatter Plot: An interactive scatter plot graphs Counter-Screen frequency (\(x\)-axis) versus Target frequency (\(y\)-axis), with diagonal guides delineating selective binders from non-specific cross-reactors.
-
Select Cross-Reactive Bulk Action: A dedicated Select Cross-Reactive button appears on the bulk action bar during cross-reactivity screening campaigns, instantly selecting all clones classified as
Cross-Reactiveacross the library for single-click candidate harvesting. -
Specialized Excel Export: Generates a dedicated Target vs Counter Specificity worksheet in the analytics Excel workbook with full read distributions and classification breakdowns.
2. Deep Mutational Scanning (DMS) & Engineering Workspace Integration
Deep Mutational Scanning profiles the functional fitness landscape of site-saturation mutagenesis libraries against a parental template antibody across all IMGT variable domain positions.
- Parental Sequence Resolution: The parental template sequence is automatically identified from annotations or baseline reads, trimmed, and numbered according to the IMGT scheme via AntPack.
- Input vs. Selected Read Normalization: Pre-selection baseline reads (\(N_{\text{in}}\)) and post-selection binding reads (\(N_{\text{sel}}\)) are tallied per substitution.
-
Log2 Enrichment Fitness Score:
\[S = \log_2\left(\frac{(C_{\text{sel}} + \epsilon) / N_{\text{sel}}}{(C_{\text{in}} + \epsilon) / N_{\text{in}}}\right)\] -
Permissibility Classification:
- Safe / Tolerated (Green): \(S \ge -0.5\), indicating substitutions that preserve or enhance antigen binding.
- Deleterious (Red): \(S < -0.5\), indicating substitutions that destabilize the fold or abolish binding.
-
Interactive 2D Mutational Fitness Landscape Heatmap: Interactive 2D matrix heatmap displaying all 20 amino acids on the Y-axis (with sticky row labels pinned to the left margin) and every sequence residue across the variable domain on the X-axis (with Light chain strictly preceding Heavy chain) with a smooth horizontal scrollbar:
- IMGT Residue Coordinates: Each position column is labeled in black font using its IMGT coordinate prefixed by chain and wild-type parental residue (e.g.
H:Y113,H:E6,L:D1). - Color-Coded Permissibility: Allowed / tolerated substitutions (\(S \ge -0.5\)) are styled on an emerald green gradient scale, deleterious mutations (\(S < -0.5\)) on a crimson red gradient scale, and parental reference residues (WT) are cleanly marked with a centered dark dot (
●). - Hover Tooltips & Filter Linking: Hovering over any cell reveals a detailed tooltip reporting position, mutation, fitness score (log2 FC), classification, and read counts. Clicking any cell or column header automatically opens the View Residue Results... modal pre-filtered to that position or substitution.
- IMGT Residue Coordinates: Each position column is labeled in black font using its IMGT coordinate prefixed by chain and wild-type parental residue (e.g.
-
Interactive Residue Landscape Modal (View Residue Results...): Clicking View Residue Results... in the workflow analytics banner opens a dedicated residue-level evaluation modal displaying the complete substitution matrix:
- Dual Coordinate Tracks (M. Linear & IMGT): Displays mature sequential numbering (M. Linear, 1-based index
1..Nstarting at the mature variable domain) side-by-side with scheme-based IMGT numbering coordinates (e.g.113) with matching bold typography. - Strict Chain Ordering: Residue records strictly order Light chain before Heavy chain, followed by mature linear sequential position.
- Real-Time Filtering: Includes real-time search filtering across positions and mutations (e.g.
102orD102E) and an Allowed (Safe) Only toggle. - Filtered CSV Export: Clicking Export CSV inside the modal dynamically obeys the Allowed (Safe) Only selector and active search filters, exporting only the active permissible substitutions.
- Dual Coordinate Tracks (M. Linear & IMGT): Displays mature sequential numbering (M. Linear, 1-based index
-
Candidate Grid Mutation Badges: In the main candidate results table, clones evaluated in DMS workflows display explicit status badges in the DMS Fitness column for
Parental(navy),Allowed(green, with mutation summary e.g.H:102 D→Eand fitness score), orDeleterious(red). -
Direct Bidirectional Bridge with Engineering Workspace: DMS evaluations integrate directly with AbLead's Engineering workspace through a seamless two-way connection:
- Push from Library Evaluation: On the candidate toolbar, click Link DMS to Engineering... to launch the project destination modal. Select an active project and target antibody; AbLead automatically packages the evaluated fitness matrix into the standardized
mutagenesis_libraryschema and binds it directly intoantibody.engineering_data. - Pull from Engineering Workspace: Within any antibody's Engineering workspace, open the Library ▾ menu and select Link from Evaluated DMS Run.... Select any completed DMS run from your account to pull its evaluated fitness data directly into the antibody.
- Instant Downstream Functionality: Linking immediately activates the Allowed status badges in the Mutation Designs table, unlocks Create Set from Library, and feeds empirical permissibility bounds into combinatorial optimization.
- Push from Library Evaluation: On the candidate toolbar, click Link DMS to Engineering... to launch the project destination modal. Select an active project and target antibody; AbLead automatically packages the evaluated fitness matrix into the standardized
-
Specialized Excel Export: Generates a dedicated DMS Residues worksheet in exported workbooks formatted with complete residue fitness records, featuring both
M. LinearandIMGTcoordinates.
3. FACS Sort-Seq Multi-Gate Affinity & Stability Binning
Sort-Seq couples fluorescence-activated cell sorting (FACS) across multiple fluorescent gates with high-throughput sequencing to quantify apparent binding affinity or surface expression stability across large clone repertoires.
- Gate Tier Assignment: Reads are demultiplexed across sorting gates (e.g. High, Medium, Low, Negative).
-
Weighted Mean Signal & Apparent Affinity Score: Computes a normalized affinity score (\(0\text{--}100\) scale) reflecting each clone's population distribution across gate fractions:
\[\text{Score} = \left(\frac{\bar{w} - 1.0}{3.0}\right) \times 100\] -
Gate Population Distribution Chart: Stacked bar chart illustrating candidate distribution percentages across sorting tiers.
- Fluorescent Gate Toolbar Filtering: A dedicated Gate dropdown filter (
All Gates,High,Medium,Low,Negative) appears in the results toolbar during Sort-Seq workflows, allowing researchers to instantly isolate candidates by their isolated sorting fraction. - Specialized Excel Export: Generates a dedicated Sort-Seq Bins worksheet detailing gate distributions and tier assignments.
4. Single-Cell AIRR & 10x Genomics Repertoire Profiling
Processes single-cell B-cell receptor (BCR) contig annotations (such as 10x Genomics Cell Ranger filtered_contig_annotations.csv or AIRR-standard TSV datasets) to characterize immune repertoire diversity.
- Cell Barcode Tracking: Contigs sharing identical 16-bp 10x cell barcodes are grouped to resolve paired heavy and light chain variable domains per single cell.
- Clonal Burst & Clonal Expansion: Calculates the exact number of physical single cells expressing each clonotype to quantify in vivo or in vitro clonal expansion.
- Somatic Hypermutation (SHM) Divergence: Measures nucleotide and amino acid mutation rates relative to putative germline V-genes.
-
Smart SHM Maturation Scoring (Binding vs. Framework Divergence): Evaluates whether somatic hypermutation (SHM) divergence from putative germline V-genes is productively focused within antigen-binding paratope zones or scattered across structural framework scaffolds:
-
Structural Exclusion Models:
- Honegger Framework Exclusions (
exclusions="honegger", Default): Employs structural framework positions defined by AbLead's Honegger humanization mask (HUMANIZATION_MASK_HC,HUMANIZATION_MASK_LC). Positions outside the mask represent binding and scaffolding contacts (\(M_{\text{bind}}\)), while mutations inside the mask represent framework divergence (\(M_{\text{FR}}\)). - CDR Scheme Exclusions (
exclusions="cdr"): Excludes canonical CDR loops using any AntPack region scheme (North, IMGT, Kabat, Martin, or Aho).
- Honegger Framework Exclusions (
-
Maturation Metric:
\[S_{\text{mat}} = M_{\text{bind}} - 1.5 \times M_{\text{FR}}\] -
Standardized Biopharma Classifications:
- Affinity-Matured Lead (\(M_{\text{bind}} \ge 2, M_{\text{FR}} \le 1\)): High binding/contact mutation burden with minimal framework divergence, indicating productive affinity maturation with low immunogenicity and structural stability risk.
- Framework Divergent (\(M_{\text{FR}} \ge 3\) or \(M_{\text{FR}} > M_{\text{bind}}\)): Heavy framework mutation accumulation, signaling destabilized scaffolds or sequencing error.
- Germline-Like (\(M_{\text{bind}} \le 1, M_{\text{FR}} \le 1\)): Unmutated or near-germline clones.
- Balanced Maturation: Moderate proportional divergence.
-
Dynamic On-the-Fly Switching & Banner Controls:
- Dashboard Banner Selectors: Interactive dropdowns embedded directly in the active workflow banner (
#bannerExclusionsSelectand#bannerCdrSchemeSelect) permit toggling between Honegger and CDR models or altering the CDR scheme (North, IMGT, Kabat, Martin, Aho) on the fly without re-evaluating or re-uploading the dataset. - Repertoire-Level Summary KPIs: Live summary pill badges report repertoire-wide metrics:
Affinity-Matured Leads,Framework Divergent,Germline-Like,Balanced,Mean Maturation Score, andMean M_bind / M_FR, providing instant visibility into repertoire quality shifts as exclusion schemes are toggled. - Import Form Configuration: The library import dialog features a dedicated Single-Cell AIRR configuration card (
#singleCellSettingsSection) to set the default exclusion strategy and CDR scheme prior to evaluation.
- Dashboard Banner Selectors: Interactive dropdowns embedded directly in the active workflow banner (
-
-
Top Clonal Burst Size Chart: Horizontal bar chart highlighting the largest expanded single-cell clonotypes.
- Specialized Excel Export: Generates a dedicated Single-Cell Repertoire worksheet reporting cell barcode counts, paired rates, top clonal bursts, maturation summary KPIs, and per-clone Maturation Category, Maturation Score, \(M_{\text{bind}}\), \(M_{\text{FR}}\), and Germline V-gene annotations.
5. Synthetic & Pre-Selection Library Quality Control
Evaluates baseline unselected or naive antibody libraries prior to selection to ensure structural viability, verify synthesis accuracy, and quantify library diversity.
- Functional Open Reading Frame (ORF) Rate: Measures the percentage of sequencing reads encoding full-length, in-frame variable domains without premature stop codons or frameshifts.
- Synthesis Burden Metrics: Reports explicit percentages of premature stop codons (
*) and frameshift indels. -
Non-Parametric Chao1 Species Richness Diversity: Estimates total library diversity taking into account rare singletons (\(f_1\)) and doubletons (\(f_2\)):
\[\hat{S}_{\text{Chao1}} = S_{\text{obs}} + \frac{f_1(f_1 - 1)}{2(f_2 + 1)}\] -
Positional Shannon Entropy (\(H(X)\)): Quantifies amino acid diversity across each variable domain position to evaluate randomization design conformity:
\[H(X) = -\sum_{i=1}^{20} p_i \log_2(p_i)\] -
Positional Shannon Entropy Line Chart: Line chart displaying positional diversity (\(0\text{--}4.32\) bits) across framework and CDR positions.
- Specialized Excel Export: Generates a dedicated Synthetic Library QC worksheet with complete quality breakdown tables and positional entropy tracks.
Interactive Filtering & Singleton Noise Isolation
High-throughput sequencing datasets inherently contain thousands of single-read variants (\(N=1\)) caused by PCR amplification errors and optical sequencer noise. AbLead provides an interactive toolbar to isolate true enriched clones.
Filtering Controls
-
Status Filter Dropdown:
All Productive (Valid & Warnings)(Default): Excludes all non-productive reads, displaying all intact, full-length antibody candidates.Productive Valid Only (No Warnings): Restricts the table strictly to 100% clean candidates without any warnings or structural variations.Warnings Only: Focuses on candidates with minor structural notices (such as non-canonical cysteines or unusual linker lengths).Non-Productive Only: Specifically displays rejected reads, automatically sorted by read frequency with clear failure tags (e.g.,Frameshift,Missing VH CDR3,Degenerate FR1 N-terminus) to troubleshoot library quality.All (Include Non-Productive): Displays the entire evaluated dataset.
-
Hide Singletons (≥2 reads) Toggle:
- Instantly eliminates \(N=1\) sequencing artifacts with a single click, collapsing thousands of noisy reads into the true enriched library members.
-
Min Reads Abundance Filter:
- Configurable numeric threshold to display clones with \(\ge 2\), \(\ge 5\), \(\ge 10\), or \(\ge 20\) reads.
-
Min Frequency (%) Filter:
- Configurable percentage threshold (e.g., \(\ge 0.01\%\)) to filter candidates by relative abundance, remaining stable across varying sequencing depths.
-
Format Filter:
- Filter displayed clones by architecture:
All Formats,scFv,VHH,Paired Fv, orFragment.
- Filter displayed clones by architecture:
-
Search:
- Real-time search across clone names, VH CDR3 sequences, and VL CDR3 sequences.
-
Interactive Stat Cards:
- Clicking the Valid Clones, Warnings, or Non-Productive stat cards in the summary header immediately applies the corresponding status filter to the table.
-
Visible Count Indicator:
- A prominent counter badge updates dynamically on every keystroke or filter toggle (e.g.,
Showing 153 of 2,353 clones).
- A prominent counter badge updates dynamically on every keystroke or filter toggle (e.g.,
Column Header Sorting & Per-Column Filtering
The candidate results grid provides full interactive sorting, per-column filtering, and active criteria tracking:
-
Interactive 3-Click Column Sorting: Clicking any sortable column header (Status, Clone Name, Clonotype, Enrichment, Workflow Metric, Abundance, Format, Chains, VL CDR3, VH CDR3, Length, and Issues / QC) toggles through a 3-state sort cycle:
- Click 1: Sort Ascending.
- Click 2: Sort Descending.
- Click 3: Clear sort and return to default ranking.
Biological chain ordering is strictly preserved: Light chain records and sequences always precede Heavy chain records.
-
Per-Column Filter Popovers: Clicking the filter icon on any column header opens a dedicated filter popover overlay:
- Text Searches: Filter by clone name substrings, clonotype IDs, or CDR3 motifs.
- Comparison Operators: Filter numerical columns using standard operators (
>,<,>=,<=,=). - Numeric Ranges: Filter values within numeric intervals (e.g.
10-50or1.5-4.0).
-
Active Filter / Sort Chips Bar: A pinned toolbar directly above the table displays interactive chips representing all active column filters and sort criteria:
- Individual Chip Dismissal: Click the
✕on any filter or sort chip to remove that constraint individually. - Clear All Filters: Click the global Clear All Filters button to reset all column filters simultaneously.
- Permanent Anti-Shift Layout: The filter chips bar remains visible at all times. When no filters or sorts are active, it displays a subtle "No active filters or sorts" empty state, preventing disruptive table and layout shifting.
- Individual Chip Dismissal: Click the
-
Gmail-Style Checkbox Deselection: The global select-all checkbox implements an intuitive indeterminate deselect behavior: if the checkbox is partially selected (some but not all candidates checked), clicking the box deselects all candidates rather than selecting everything.
Dynamic Post-Run Clonal Deduplication & Badge Legend
-
Dynamic Deduplication Toggle: The results toolbar includes an instantaneous Deduplicate Shared Sequences toggle switch. Researchers can switch between:
- Well Preservation (Default): Every physical designated well is displayed with its well coordinates (e.g.
[A01] Clone_Name), maintaining complete genotype-to-phenotype linkage. Clones with shared sequences across wells are marked with amberShared Seqbadges. - Collapsed Unique Sequences: Clones with identical protein sequences across multiple wells are dynamically collapsed in the browser into the primary well, displaying an
N Wellsbadge.
Switching modes updates the candidate grid, selection state, and export counts in real time without requiring a re-run or re-upload.
- Well Preservation (Default): Every physical designated well is displayed with its well coordinates (e.g.
-
Duplicate Sequence Naming & Primary Representative Selection: When multiple reads or wells share an identical translated protein sequence, the clone identity, primary coordinate, and name are determined as follows:
-
Plate-Demultiplexed Datasets (Barcoded Wells / Plate Maps): When identical full-length antibody protein sequences appear across multiple physical wells and cross-well deduplication is applied (either during pre-run ingestion via Cross-Well Clonal Deduplication or dynamically in the results toolbar via Deduplicate Shared Sequences):
- All designated wells sharing identical translated heavy and light variable domain sequences are grouped into a duplicate cluster.
- The primary representative clone is selected by highest sequencing read count (
-count). The physical well that generated the greatest number of reads becomes the primary entry, inheriting that well's coordinate and assigned clone name (e.g.[B04] Clone_B). If read counts tie, the first well encountered in designated plate coordinate order is retained as primary. - All other matching duplicate wells are recorded as collapsed aliases in
collapsed_wells(e.g.Collapsed from 3 wells: A01: Clone_A, C07: Clone_C), and their read counts are summed into the primary clone's cumulative abundance count and frequency percentage. - In Well Preservation (Default) mode, each physical well remains an independent row in the table under its own well coordinate and clone name, flagged with an amber
Shared Seqbadge and hover notes detailing all companion wells sharing the identical sequence.
-
Bulk Sequencing Datasets (No Plate Map / FASTA / FASTQ): For bulk sequencing libraries without microplate coordinates:
- Identical raw nucleotide reads are pre-collapsed, and the clone is assigned the defline header of the first read encountered in the input file.
- Productive clones sharing identical translated variable domain amino acid sequences (e.g., synonymous nucleotide variants) are consolidated, retaining the clone name of the first evaluated candidate encountered in the input sequence stream, while summing read counts.
-
-
Expandable Badge Legend & Metric Guide: An expandable visual guide details all status badges and annotations:
[A01]: Physical well coordinate assigned to the clone.Shared Seq: Identical antibody protein sequence observed across multiple physical wells.N Wells: Count of physical wells collapsed into this single dominant clone.% of well: Fraction of sequencing reads within that physical well assigned to this dominant consensus sequence.VL + VH(Green Checkmark): Intact paired antibody containing both complete Light and Heavy variable domains.Valid,Warning,Non-Productive: IMGT domain completeness and structural integrity categories.CL-001(Gold Crown): Clonotype Lead — Dominant representative clone with highest read abundance in that clonal family.CL-001(Slate Branch): Clonal Variant — Somatic hypermutation variant or point mutant belonging to that clonal family, linked back to the dominant lead.+X.Xx(Green / Red / Purple / Slate Pill): Biopanning Enrichment — Fold change expansion relative to baseline round, with hover tooltips detailing round-by-round frequency progression.Length (aa): Standardized variable domain length (\(\text{VL} + \text{VH}\) for scFv/Fv, or single domain for VHH), matching the length displayed when pushed to an AbLead project. Hovering reveals full amplicon and linker details for scFvs.
Visual Analytics Dashboard
The evaluation dashboard provides high-level insight into library quality, clonal diversity, and loop length distributions through five interactive charts, a dedicated Clonal Clade Tree viewer, and an interactive 2D Sequence Space Landscape (UMAP / MDS).
1. Read Length Distribution
A histogram displaying read lengths across the dataset. This visualization makes it easy to differentiate clean full-length amplicons (\(\sim 750\text{--}850\) bp for scFvs, \(\sim 350\text{--}400\) bp for VHHs) from primer-dimers and truncated PCR aborts (\(<200\) bp).
2. Library QC & Completeness Breakdown
A donut chart displaying the relative proportions of:
- Valid Full-Length Clones (Green)
- Warning Clones (Amber)
- Non-Productive / Fragments (Red)
3. Top Clonal Abundance Ranking
A horizontal bar chart displaying the top 15 unique clones ranked by total read count and population frequency percentage (\(f = N_{\text{reads}} / N_{\text{total}} \times 100\%\)). In enriched panning campaigns, dominant hits stand out prominently.
4. Clonal Read Depth Distribution (Depth Bins)
A vertical frequency histogram across 100% of productive clones in the library, binned into standard sequencing depth tiers:
1 (Singleton): Clones supported by a single sequencing read.2–5 reads: Low-frequency variants.6–20 reads: Moderately sampled clones.21–100 reads: Enriched candidates.101–500 reads: High-abundance binders.>500 reads: Dominant clonal expansions.
Hover tooltips report the exact clone count, percentage of total library diversity, and cumulative sequencing read volume captured within that depth bracket, allowing researchers to evaluate library diversity and distinguish single-read noise from bona fide binders.
5. CDR3 Loop Length Distribution
A grouped bar chart displaying the frequency distribution of CDR3 loop lengths:
- Light Chain CDR3 (
VL) (Dodger Blue): Placed first to maintain compliance with Light before Heavy ordering. - Heavy Chain CDR3 (
VH) (Dark Cyan).
6. Biopanning Kinetics Trajectory Plot
When multi-round biopanning datasets are evaluated, an interactive multi-line chart dynamically plots candidate library frequency percentages across selection rounds (\(R_1 \to R_2 \to R_3 \dots\)) for top enriched leads. Hover tooltips report the exact round frequency percentage, providing direct visual confirmation of candidate amplification kinetics.
7. Rarefaction & Discovery Completeness Curves
Analytical species accumulation and extrapolation curves quantify whether sequencing depth has saturated clone discovery in the library:
-
Sanders/Hurlbert Analytical Rarefaction (\(m \le N\)): Computes expected unique clone discovery across downsampled sequencing depths without stochastic bootstrap jitter:
\[\hat{S}(m) = S_{\text{obs}} - \sum_{k=1}^N f_k \frac{\binom{N-k}{m}}{\binom{N}{m}}\] -
Chao et al. (2014) Non-Parametric Extrapolation (\(m > N\)): Extrapolates clone discovery out to \(2\times\) current sequencing depth to project asymptotic yield.
- Chao1 Richness & Discovery Completeness: Quantifies estimated total repertoire diversity and reports discovery completeness percentage (\(S_{\text{obs}} / \hat{S}_{\text{Chao1}} \times 100\%\)).
- Multi-Round Tracking: Plots independent rarefaction trajectories across each biopanning round, illustrating the collapse of diversity and enrichment saturation.
8. Cross-Round CDR3 Spectratype Dynamics
Visualizes the progressive expansion or contraction of CDR3 loop length distributions across successive selection rounds:
- Chain Ordering: Features a segmented toggle to switch between Light Chain (
VL) and Heavy Chain (VH), with Light Chain strictly presented first. - Loop Length Evolution: Grouped bar charts display loop length frequencies (\(7\text{--}24\) residues) per round, revealing length-dependent selection preferences or structural gating during antigen engagement.
9. Clonal Lineage & Clade Tree with Full-Length Sequence Alignment
An interactive phylogenetic cladogram and sequence alignment viewer provides high-resolution insight into clonal lineages, somatic relationships, and residue substitutions across top productive candidates:
- Upper-Right Collapse Toggle & Toolbar: Housed in a dedicated analytics card with an independent Collapse Clade Tree / Expand Clade Tree button positioned in the upper-right corner of the card header—consistent with the Analytics Charts card. Sequence mode, clone depth, and calculation triggers reside in a dedicated controls toolbar directly below.
- De-Collapsed Hierarchical Cladogram: Reconstructs phylogenetic branching relationships using a hybrid topological and distance model. Every branching level advances with a guaranteed minimum horizontal step (\(\ge 18\text{px}\)) and subtle internal node dots (
#94a3b8), preventing identical or near-identical clones from collapsing into a single vertical line. - Proportional Black Leaf Nodes: Clade leaf nodes are rendered in solid black with compact radii (\(3.0\text{--}6.5\text{ px}\)) scaled logarithmically to sequencing read abundance, making high-abundance clones immediately distinct from low-frequency variants.
- Standard Milestone Read Tiers: The abundance legend displays clean, rounded milestone tiers (e.g. 100, 250, 500, 750 reads) rather than arbitrary raw dataset values.
-
Fixed Tree & Scrollable Sequence Colors: Features a dual-pane freeze-pane layout:
- Fixed Left Column (\(520\text{px}\)): The tree diagram, internal vertices, compact leaf nodes, and complete clone identifier labels (
[Well] Clone_Name) remain sticky on the left during horizontal scrolling with generous width to prevent label truncation. - System Numbering Gapping: Aligned residue sequences are gapped according to system numbering (default IMGT, or Kabat/Martin/Aho), aligning framework regions (FR1–FR4) and CDR loops into true vertical columns with gap characters (
-) placed at absent positions. - Non-Scrollable Sticky Top Ruler: The sequence domain banners (
Light Chain VL,Heavy Chain VH) and system numbering position ruler are pinned in a sticky top header row (position: sticky; top: 0), remaining visible when scrolling vertically through clones while scrolling horizontally in sync with the sequence grid. - Individual Amino Acid Colors & Residue Letters: Each of the 20 amino acids is rendered in its own distinct individual color matching the standard
VDJRegion aapalette, with small, bold white single-letter residue codes centered in each cell. Gaps (-) remain cleanly unlabelled. - Light Chain Strictly Before Heavy Chain: Across all alignment tracks, domain banners (
Light Chain VLfollowed byHeavy Chain VH), and position rulers, the Light chain is always positioned first.
- Fixed Left Column (\(520\text{px}\)): The tree diagram, internal vertices, compact leaf nodes, and complete clone identifier labels (
-
Interactive Guidance Banner: A permanent instruction bar above the tree viewport details interactions: clicking a node to view clone details and CDR sequences, clicking a branch to focus a clade and isolate somatic mutations, and dismiss controls (
Click × to close tooltip • Click branch again to turn off). -
Interactive Branch Click-to-Fade & Invariant Residue Fading: Clicking any horizontal tree branch isolates that branch's sub-clade for focused comparative analysis:
- Sub-Clade Isolation: Sequence rows and leaf nodes belonging to the clicked branch remain at full brightness (100% opacity), while all non-descendant sequence rows softly fade to 15% opacity (
filter: grayscale(60%)) and non-selected leaf nodes dim to 35% opacity. - Intra-Clade Invariant Residue Fading: For the focused sub-clade, amino acid positions that are 100% conserved across all member clones softly fade to 35% opacity. This automatically emphasizes polymorphic and mutating positions within the clade, which remain vivid at 100% opacity.
- Active Branch Illumination & Clade Focus Badge: The selected horizontal branch illuminates in vivid blue with a subtle glow drop-shadow. A clearable pill badge (
Clade: N clones [×]) appears in the sticky header corner. - 1-Click Toggle & Second-Click Reset: Clicking the active branch a second time or clicking the
[×]button on the header badge turns off clade focus and restores all sequence rows and residue cells to full opacity.
- Sub-Clade Isolation: Sequence rows and leaf nodes belonging to the clicked branch remain at full brightness (100% opacity), while all non-descendant sequence rows softly fade to 15% opacity (
-
Non-Overlapping Legend Sidebar: A dedicated right-hand sidebar houses the Number of Reads abundance circle scale and the complete 20-amino-acid
VDJRegion aaindividual color key, ensuring the legend never obscures tree branches. - Bi-Directional Hover Highlighting: Hovering over any tree leaf node or sequence row highlights its corresponding sequence row and node circle without opening tooltips.
-
Click-to-Show Node Details Popover: Clicking directly on a tree leaf node opens an interactive dark details popover displaying full CDR1, CDR2, and CDR3 sequences with one-click clipboard copying, well coordinates, sequencing read count, library abundance frequency, validation status, and a Show in Table navigation button:
- Persistent Navigation: Clicking Show in Table smoothly scrolls the candidate table to center and highlight that clone with a temporary blue highlight flash—switching pagination pages automatically if needed—while keeping the node popover open so researchers can cross-reference both views.
- Dedicated Close Button: The popover remains open until closed via the dedicated close (
✕) button or when clicking another node.
-
Dynamic Table Filter Reflection: When table filters are active (such as Group by Clonotype, Min Fold Change, status, or search queries), clicking Generate Clade Tree dynamically passes the filtered candidate subset to the phylogenetic engine, constructing a streamlined tree representing only the visible clones. If no filters are active, it builds from all productive clones in the library.
-
Multi-Format Export Suite (.svg, .xlsx, .nwk, .fasta): A dedicated Export Tree dropdown on the Clade Tree toolbar enables one-click exporting of the tree graphic, sequence alignments, clonal metrics, and pairwise distance matrix across four standard formats:
-
Publication-Grade Vector Graphic (.svg): Generates a complete, self-contained SVG graphic combining the tree dendrogram, read-abundance proportional leaf nodes, clone labels, domain ribbons, decennial position ruler, per-residue colored alignment cells with monospace amino acid letters, and complete legend panels (Number of Reads, Region Colors, and VDJRegion Amino Acid palette).
- Interactive Clade Selection & Somatic Mutation Fading: When a branch is clicked to isolate a sub-clade, the exported SVG faithfully preserves the active visual state—highlighting the selected horizontal branch in royal blue (
#2563eb,stroke-width="3"), dimming non-clade lineages and sequence rows to 15% opacity, and softening 100% conserved positions within the clade to 35% opacity so divergent somatic hypermutations pop out at full intensity (100% opacity). Clade leaf nodes maintain standard crisp white outlines (#ffffff), and a boldFocused Clade (N clones)indicator is anchored to the right header margin to eliminate text collision.
- Interactive Clade Selection & Somatic Mutation Fading: When a branch is clicked to isolate a sub-clade, the exported SVG faithfully preserves the active visual state—highlighting the selected horizontal branch in royal blue (
-
Multi-Tabbed Excel Clade Alignment & Lineage (.xlsx): Generates a 3-tab workbook styled with canonical region colors and luminance-contrasted typography:
- Clade Alignment: Two-tier headers (variable domain span ribbons on row 5 and numbering position codes on row 6), clones ordered by phylogenetic tree leaf order, and position cells styled with
PatternFillmatchingVDJREGION_AA_COLORS_HEX(preserving strict Light-chain-before-Heavy-chain order). - Clones & Lineage: Complete clonal profiles including well coordinates, status, read depth, clonal frequency, domain lengths, and extracted CDR1, CDR2, and CDR3 sequences.
- Distance Matrix: Symmetric \(N \times N\) pairwise sequence percentage distance matrix between all evaluated clones in tree leaf order with soft diagonal styling.
- Clade Alignment: Two-tier headers (variable domain span ribbons on row 5 and numbering position codes on row 6), clones ordered by phylogenetic tree leaf order, and position cells styled with
-
Phylogenetic Newick Tree (.nwk): Produces a standard Newick tree file with ultrametric branch lengths calculated from linkage distances (
node.dist / 2.0) and descriptive leaf taxon labels ('[Well] Name'), ready for direct downstream phylogenetic analysis and publication figure generation in external tools (e.g. FigTree, iTOL, Dendroscope, MEGA, Auspice). - Aligned Gapped FASTA (.fasta): Outputs position-aligned sequences ordered by tree leaf rank with informative sequence deflines detailing well coordinates, sequencing read depth, clonal frequency, and numbering scheme (
>[Well] Name | reads=N | freq=X% | well_freq=Y% | scheme=SCHEME).
-
10. Sequence Space Landscape (UMAP & Classical MDS 2D Projection)
An interactive 2D dimensionality reduction engine projecting the entire productive antibody repertoire into a continuous topological sequence space. While phylogenetic cladograms show vertical hierarchical lineage relationships, the Sequence Space Landscape visualizes global sequence convergence and divergence across all candidate clones simultaneously, allowing researchers to quickly spot dominant binding islands, identify isolated orphan lineages, and eliminate non-specific matrix binders:
-
Non-Linear UMAP & Classical MDS (PCoA) Manifold Projection: Pairwise sequence divergence is computed across evaluated repertoire sequences using thread-safe Numba JIT-accelerated edit and Hamming distance kernels. High-dimensional distance matrices are mapped into an interactive 2D coordinate space via:
- UMAP (Uniform Manifold Approximation and Projection): Non-linear manifold learning preserving both fine-grained local neighborhood relationships and broad global cluster topology. Supports configurable nearest neighbors (\(k\), default 15) and minimum distance (\(d = 0.10\)).
- Classical MDS (PCoA - Principal Coordinate Analysis): Linear metric multidimensional scaling computed via double centering (\(B = -0.5 H D^2 H\)) and symmetric matrix eigendecomposition, providing an instantaneous layout (<10 ms) with zero configuration.
-
Strict Light-Chain-Before-Heavy-Chain Rule: In strict compliance with AbLead architectural rules, all pairwise sequence distance calculations and coordinate projections concatenate the Light chain (\(V_L\)) strictly before the Heavy chain (\(V_H\)).
-
Sequence Region Extraction Modes: Researchers can alter the analytical lens to evaluate homology across specific functional antibody segments:
- Full Variable Domains (
both) (Default): Compares full-length paired \(V_L + V_H\) sequences, capturing both framework divergence and CDR diversity. - All CDRs (
cdrs): Concatenates CDR1, CDR2, and CDR3 loops across both chains (\(L_1L_2L_3 \mid H_1H_2H_3\)), filtering out framework polymorphisms to focus solely on paratope architecture. - CDR3 Only (
cdr3): Compares hypervariable \(L_3 \mid H_3\) loops, the principal determinants of antigen binding specificity and V(D)J junctional diversity. - Heavy Chain Only (
heavy): Compares isolated \(V_H\) domains or heavy CDRs. - Light Chain Only (
light): Compares isolated \(V_L\) domains or light CDRs.
- Full Variable Domains (
-
Phenotypic Enrichment Quality & Color Overlays: Points on the 2D landscape are dynamically color-coded to cross-reference sequence homology with experimental selection behavior:
-
Enrichment Quality (Default): Classifies clones into standardized discovery tiers based on multi-round biopanning kinetics, FACS sorting gate fractions, or Deep Mutational Scanning (DMS) fitness:
- Stable Binders (
#10b981Emerald green): Clones that consistently enrich across consecutive selection rounds (\(R_1 \to R_2 \to R_3\), \(\log_2(\text{FC}) \ge 1.5\)) or partition into high-affinity FACS sorting gates. - Rescuers (
#84cc16Lime green): Clones exhibiting late-emerging clonal expansion dynamics in later selection cycles. - Weak Binders (
#eab308Amber yellow): Clones with moderate or plateauing enrichment. - Non-Binders / Depleted Clones (
#94a3b8Slate gray): Fast-growing background artifacts, depleted clones, or clones with negative fold change. - NA / Baseline (
#cbd5e1Light gray): Single-round baselines or unclassified clones.
- Stable Binders (
-
Clonotype Families: A 20-color qualitative palette highlighting dominant clonal families (
CL-001,CL-002, ...), making it immediately apparent whether distinct sequence islands represent unique germline lineages or divergent somatic variants. - Read Abundance: Continuous logarithmic color gradient (\(\log_{10}\text{reads}\)) from Slate Blue (
#3b82f6) to Crimson (#ef4444). - Liability Burden: Color-codes candidates by their developability liability count (0 Clean, 1, 2, 3+ liabilities) to identify liability-free clusters.
-
-
Instant In-Memory Color Switching (0 ms): Because 2D coordinate positions (\(x, y\)) are invariant to the active color overlay, switching between Enrichment Quality, Clonotype Families, Read Abundance, and Liabilities executes entirely client-side in browser memory with zero network delay and zero layout recalculation.
-
Dominant Clonal Leads & Interactive Tooltips: Dominant leads (highest read abundance per clonal family) are highlighted on the plot with enlarged point radii (\(r = 6.5\text{px}\)) and star badges (
★ Dominant Lead). Hover tooltips report clone name, enrichment tier, clonotype ID and rank, sequencing reads, \(\log_2(\text{FC})\), kinetic trajectory, sequence liabilities count, and CDR3 sequences. -
Bi-Directional Table Navigation: Clicking any point in the 2D sequence space automatically scrolls the Candidate Evaluation Table below directly to that clone, smoothly centering it in the viewport, auto-advancing table pagination if necessary, and applying a temporary glowing highlight pulse.
-
Interactive Freehand Lasso Selection Tool: A dedicated Lasso Select tool in the Sequence Space toolbar enables graphical gating directly on the 2D scatter plot:
- Freehand Drawing: Click and drag across the canvas to draw an arbitrary loop or gating boundary around any cluster, island, or region of interest.
- Real-Time Jordan Ray-Casting: Releasing the mouse instantly identifies all enclosed antibody clones using a client-side point-in-polygon algorithm (\(<1\) ms).
- Candidate Grid Synchronization: Checkboxes for all enclosed clones in the Candidate Evaluation Table below are automatically checked, and the floating Bulk Action bar immediately activates (
N items selected), allowing one-click downstream export (FASTA, Excel), project commit, or triaging. - Glowing Selection Haloes: Enclosed points on the 2D scatter plot light up with glowing blue selection haloes.
- Additive Multi-Lasso Gating with On-Graph Persistence: Holding
Shiftwhile lassoing allows drawing multiple non-contiguous loops to accumulate candidate clusters. All previously drawn lasso loops remain visible on the graph with their dashed perimeters, translucent fills, and glowing point haloes across selections. - Legend Chip Visibility Filtering: The lasso selection engine automatically respects legend chip toggles, ensuring only currently visible/active categories are evaluated or selected.
- 1-Click Deselection: Clicking the background or clicking the Clear button resets the lasso boundary and clears table selections.
-
High-Resolution Graphic & Coordinate Exports: The Export dropdown provides one-click downloads:
- Scatter Chart (.png): Publication-grade high-resolution raster graphic of the active 2D sequence space.
- 2D Coordinates (.csv): Full 15-column coordinate spreadsheet (
[LibraryName]_Sequence_Space_Coordinates.csv) containing clone names, UMAP dimensions (\(x, y\)), enrichment quality tiers, clonotype metadata, reads, and CDR sequences.
11. Multi-Tabbed Analytics Excel Export (.xlsx)
Researchers can export the entire visual analytics suite as a publication-ready Excel workbook (.xlsx) by clicking Export Analytics (Excel) in the Library Evaluation Analytics card header:
-
1:1 Alignment with Visual Cards:
- Overview & QC: High-level library metadata, total read depth, unique clones count, QC validation breakdown table, and an embedded native Doughnut chart visualizing Valid, Warning, and Non-Productive clone proportions.
- Plate Heatmap & Wells: Physical 8x12 microplate matrix color-coded by read depth with summary statistics (max, median, min), followed by detailed well-by-well tabular metrics (conditional upon plate demultiplexing data).
- Read Length Distribution: Tabular read length bins with read counts and percentages, paired with a native vertical Column Bar chart in Deep Navy (
#1E3A8A). - Top Clonal Abundance: Top candidate clones ranked by read depth, clonotype identifier, and library abundance percentages in exact visual parity with the web interface, paired with an embedded horizontal Bar chart in Dark Cyan (
#008B8B) with the top candidate positioned at the top. - Read Depth Bins: Sequencing coverage distribution across depth tiers (
1 (Singleton),2–5,6–20,21–100,101–500,>500) reporting clone counts, percentage of library, cumulative reads, and read volume percentages, paired with a native Column Bar chart in Sky Blue (#0284C7). - CDR3 Loop Lengths: Tabular amino acid length frequencies for Light (VL) and Heavy (VH) chains (strictly preserving Light before Heavy chain order), paired with an embedded clustered Bar chart colored Dodger Blue (
#1E90FF) for VL and Dark Cyan (#008B8B) for VH. - Rarefaction & Completeness: Tabular analytical interpolation and non-parametric extrapolation points across downsampled depths (\(m \le N\)) and forward projections (\(m > N\)), Chao1 richness estimates, and discovery completeness percentages, paired with an embedded native Line chart with forest green tab styling (
#107C41). - Cross-Round Spectratypes: Tabular CDR3 loop length frequencies across selection rounds for Light Chain (VL) followed by Heavy Chain (VH), paired with embedded clustered Bar charts visualizing loop expansion and contraction across panning cycles with purple tab styling (
#5C2D91). - Biopanning Kinetics: Multi-round enrichment dynamics, fold changes, \(\log_2(\text{FC})\), trajectory classifications (
Stable Binder,Rescuer,Non-Specific Binder,Selection Artifact,Weak Binder,Depleting), and round-by-round percentages, paired with an embedded trajectory Line chart with circle markers, synchronized web colors, and clean clone name series labels (conditional upon multi-round kinetics).
-
High-Contrast Display & OpenXML Optimization: Embedded charts feature pre-cached string category labels (
StrRef) and numeric caches (NumRef), high-contrast axis tick labels, non-overlapping chart and axis titles (overlay = False), and file names timestamped in the user's account timezone.
Candidate Selection & Project Ingestion
Once the dataset is filtered to desired high-confidence clones:
- Clean Initial State: Results load with zero candidates selected, ensuring researchers intentionally choose which enriched clones to import.
-
Shift-Click Range Selection:
- Click any candidate's checkbox or checkbox cell, then Shift-click another row to instantly select or deselect the entire contiguous range of candidates in between.
-
Bulk Action Controls:
- Select Valid Only: Selects all currently visible 100% clean clones with zero warnings.
- Select All Productive: Selects all currently visible productive clones (both valid and warning candidates).
- Select 1 per Clonotype: Selects only the dominant lead candidate from every visible clonal family, filtering out somatic variants and PCR noise.
-
1-Click Diversity-First Selection (96-Well / Customizable): Launches the Diversity-First Panel Picker modal to harvest a balanced, high-affinity lead panel spanning distinct clonal lineages while enforcing developability and specificity safety gates:
- Target Panel Size (Number of Leads): Select from standard laboratory microplate formats—24 Leads (quarter-plate screening), 48 Leads (half-plate screening), 96 Leads (standard 96-well plate, default), 192 Leads (2x 96-well plates), 384 Leads (high-throughput 384-well plate)—or enter an arbitrary Custom Size (\(1\text{--}5000\) leads).
-
Clonal Family Representation:
- 1 Lead per Clonotype (Maximal Lineage Diversity, Default): Restricts selection to at most one lead per clonal family, maximizing the number of distinct germline/CDR3 lineages represented in the harvested panel.
- Up to 2 Leads per Clonotype (Lead + Best Variant): Allows picking the dominant lead plus the highest-ranking somatic variant from each family, enabling evaluation of intraclonal affinity maturation.
- Unlimited (Proportional to Family Size / Fitness): Permits multiple leads per lineage proportional to family expansion and ranking fitness.
-
Rank Candidates Within Lineages By:
- Biopanning Fold-Change / Enrichment (Kinetics, Default): Ranks clones within each lineage by multi-round amplification fold change (\(\text{FC}\) and \(\log_2\text{FC}\)).
- Sequencing Read Depth / Abundance: Ranks clones by total sequencing reads and library frequency percentage.
- Cleanest Sequence First (Zero PTM Liabilities): Prioritizes clones with zero PTM liabilities (
Cleanrisk tier) first, sorting secondarily by abundance or enrichment.
-
Quality & Specificity Gates:
- Exclude High-Risk PTM Liabilities (Default On): Automatically excludes candidates in the
HighPTM risk tier (e.g. unpaired cysteines, N-linked glycosylation, high deamidation). - Require Antigen-Specific (Default On): Automatically filters out candidates classified as
Non-Specific(matrix/bead binders) orSelection Artifactbased on negative control screening. - Productive / Canonical Only (Default On): Filters out non-productive reads, stop codons, or structural anomalies.
- Exclude High-Risk PTM Liabilities (Default On): Automatically excludes candidates in the
-
Live Availability Preview: The modal dynamically computes and reports the pool of available candidates and distinct lineages meeting the active constraints in real time (e.g.
Eligible candidates: 96 across 42 distinct clonal lineages). - Round-Robin Lead Allocation Engine: The algorithm partitions eligible candidates by clonal lineage, ranks candidates within each lineage by the selected criterion, and executes a fair round-robin traversal across lineages. Turn 1 selects the top-ranked candidate from every lineage; subsequent turns select secondary candidates from lineages with remaining capacity until the panel quota is met. Selected candidates are instantly checked in the candidate table, activating the persistent bulk action bar for immediate one-click FASTA/Excel export or project import.
-
Deselect All: Clears all active selections.
-
Export Sequences (FASTA & CSV):
-
Export Sequences Dropdown Menu: Clicking Export Sequences on the bulk action bar displays an interactive menu allowing researchers to download selected candidate sequences across multiple protein, nucleotide, and demultiplexing formats:
-
Protein (.fasta): Downloads a multi-FASTA file (
[LibraryName]_protein.fasta) containing translated variable domain amino acid sequences. Clones are exported with Light chain (_LC) strictly before Heavy chain (_HC) for scFv and paired Fv formats, or single heavy chain (_HC) for VHH formats. FASTA deflines preserve comprehensive clonal metadata including well position, clonotype ID, biopanning enrichment fold change, read depth, and library frequency (e.g.,>CloneName_LC well=A01 clonotype=CLONO_0001 enrichment_fc=4.5 reads=805 freq=5.06%). -
Nucleotide — Variable Domains (.fasta): Downloads a multi-FASTA file (
[LibraryName]_nucleotide.fasta) containing clean, pre-translation in-frame domain coding nucleotide sequences:- In-Frame Domain Coding (Frame 1 Translation): Domain nucleotide sequences are extracted directly from the oriented coding strand. Sequences begin precisely at codon 1 (IMGT position 1) and end at the final codon of Framework 4, stripping away 5' and 3' vector backbones, leader peptides, linkers, tags, and stop codons. Every record translates cleanly into the exact validated protein sequence in standard reading frame 1 without needing frame-shift offsets.
- Universal Format Support (scFv, Fv, and VHH): Supports scFv, paired Fv, and VHH single-domain formats. For scFv and paired Fv clones, the nucleotide sequence is exported as separate in-frame domain records with Light chain (
_LC) strictly preceding Heavy chain (_HC). For VHH clones, the single heavy domain nucleotide sequence is exported (_HC). - Re-Evaluation Notice: Nucleotide tracking is integrated directly into the sequencing evaluation pipeline. If a library was evaluated prior to nucleotide tracking or evaluated from protein sequences, an alert informs the user that candidate clones lack stored nucleotide sequences. Re-evaluating or re-uploading the library automatically extracts and stores the coding nucleotide sequences.
-
Nucleotide — Flanked with Barcodes (.fasta): Downloads a multi-FASTA file (
[LibraryName]_nucleotide_flanked.fasta) where the variable domain nucleotide sequence is physically concatenated between detected 5' and 3' dual-index barcodes:\[\text{5'-}[\text{i5 Barcode}] - [\text{Variable Domain NT}] - [\text{i7 Barcode}]\text{-3'}\]For single-cell AIRR datasets, the 16-bp cell barcode is prepended to the domain sequence. FASTA definition lines explicitly annotate barcode IDs and sequences (e.g.
>CloneName_LC well=A01 i5=D501(TATAGCCT) i7=D701(ATTACTCG) reads=805 freq=5.06%). Built directly from the validated variable domain and canonical kit/plate map barcode sequences, this provides a standardized construct ideal for synthesis ordering or oligo design. Light chain (_LC) strictly precedes Heavy chain (_HC). -
Nucleotide — Full Consensus Amplicons (.fasta): Downloads a multi-FASTA file (
[LibraryName]_consensus_amplicons.fasta) containing the authentic, unclipped consensus sequencing reads (raw_nt,light_raw_nt,heavy_raw_nt) directly from your input FASTQ/FASTA data. Preserves native primers, adapters, leader peptides, linkers, and barcode junctions exactly as sequenced on the instrument, with full defline metadata annotations. Light chain (_LC) strictly precedes Heavy chain (_HC). -
Barcode Demux Sample Sheet (.csv): Generates a 23-column microplate mapping spreadsheet (
[LibraryName]_barcode_sample_sheet.csv) containing physical well coordinates, dual-index barcode IDs, canonical barcode sequences, CDR3 sequences, variable domain NTs, flanked construct NTs, full raw amplicon NTs, translated protein sequences, and read depths. Ideal for liquid handlers, synthesis order sheets, or LIMS sample tracking. -
DMS Residue Matrix (.csv): When viewing Deep Mutational Scanning runs, click DMS Residue Matrix (.csv) in the export menu to download the complete residue tolerance matrix (
[LibraryName]_dms_residues.csv). Formatted withChain,M. Linear,IMGT,Parental,Mutant,BindingScore,IsParental, andIsAllowed(where both parental residues and tolerated mutations are set to 1, and deleterious mutations are set to 0), strictly ordering Light chain before Heavy chain. (Note: In the View Residue Results... modal dialog, the Export CSV button dynamically obeys the Allowed (Safe) Only selector and active search queries, exporting only the filtered permissible substitutions).
-
-
Clade Tree Aligned FASTA: In the Clade Tree toolbar, click Export Tree > Aligned FASTA (.fasta) to download gapped sequences for evaluated clones in phylogenetic leaf order.
-
-
Export Excel Workbooks (.xlsx):
- Export Candidate Clones: In the results table header, click Export Excel to download an analysis-ready spreadsheet containing the full candidate clone roster with quality control status, well locations, companion shared sequence wells/clones (
Shared Sequences), Clonotype ID, Family Size, Dominant Lead Status, Enrichment Fold Change, Log2 Fold Change, Kinetic Trajectory, and per-round frequency breakdowns. Formatted with Light chain columns strictly before Heavy chain columns. For DMS screening campaigns, the exported workbook automatically includes a dedicated, styled DMS Residues worksheet reporting bothM. LinearandIMGTcoordinates with color-coded permissibility badges. - Export Analytics: In the Library Evaluation Analytics card header, click Export Analytics (Excel) to download a multi-tabbed workbook containing all quality control, depth bin, loop length, abundance, and kinetics distributions with embedded native dynamic Excel charts.
- Export Clade Tree: In the Clade Tree toolbar, click Export Tree > Excel Workbook (.xlsx) to download a 3-tab workbook with VDJRegion-colored sequence alignments, clonal lineage summaries, and pairwise percentage distance matrices.
- Export Candidate Clones: In the results table header, click Export Excel to download an analysis-ready spreadsheet containing the full candidate clone roster with quality control status, well locations, companion shared sequence wells/clones (
-
Import Selected to Project:
- Click Import Selected to Project to automatically transfer chosen candidates into a new or existing discovery project.
- Automated Defect Filtering: Clones categorized as
Non-ProductiveorGarbage(e.g. truncated fragments, internal stop codons, or aberrant frameshift chimeras) are automatically excluded during project ingestion, preventing project corruption. - Exclude Sequence Warnings Option: The confirmation modal includes an amber warning notice and an Exclude clones with sequence warnings (recommended) toggle. When enabled, warning candidates (such as potential frameshift slippages or low-dominance consensus calls) are excluded, ensuring only 100% verified canonical clones enter the discovery project.
- Transparent Ingestion Feedback: Confirmation notifications report exact counts of successfully imported antibodies as well as counts of excluded defective and warning clones.
- Read counts, frequencies, clonotype, and kinetics are preserved in the antibody's source file metadata.
- The system immediately begins full developability analysis, liability detection, humanness scoring, and structural modeling.
In-Database Persistence & Clonal Harvesting
Evaluated library runs are permanently preserved directly in your account's database, allowing you to return to any previous sequencing campaign at any time to pull additional clones or review quality control distributions:
- 100% In-Database Storage: Quality control summary counters, plate demultiplexing results, interactive chart distributions, and evaluated clone sequences are stored in the database. Bulky raw FASTQ reads and plate maps are cleaned up upon evaluation completion.
- High-Capacity Client-Side Pagination: The evaluation table features client-side pagination with selectable page sizes (100, 250, 500, or All clones per page) and quick range navigation (
First,Previous,Next,Last). Selections are maintained across pages and filters without freezing the browser DOM even on 10,000+ clone datasets. -
Import Destination Modal: When clicking Import Selected to Project, a modal lets you choose between:
- Append to Existing Project: Select an existing project from a dropdown to add the selected candidate clones directly into an active campaign.
- Create New Project: Enter a new project title to spin off a new analysis project.
-
Clonal Lineage & Harvest Tracking: Clones track their complete import lineage. Evaluated clones that have already been imported into one or more projects display a green
Importedbadge with hover tooltips detailing destination project titles and timestamps. An Import Status filter allows isolatingAll Clones,Not Yet Imported, orAlready Importedcandidates. - Dashboard Library Management: On the main Dashboard, a segmented view toggle (
Projects,Libraries,All Items) provides a dedicated grid for library runs. Users can inspect read depth, clone diversity, QC breakdowns, and harvested clone counts, open runs with a single click, or move runs to Trash. Descriptive library notes appear directly as subtext underneath the library name; double-clicking the library name edits the title, while double-clicking the notes subtext enables inline editing of the description at any time. - Active Run Banner & Saved Library Switcher: An active run banner above the upload form displays the current library name, run ID, and harvested clone counts, with quick actions to switch between saved runs or start a new evaluation. Clicking Edit Notes in the banner opens an instant prompt to update the library description directly.
-
Full Library Archive Export (.zip): On the active run banner, click Export (.zip) to download a complete compressed package of the library evaluation containing:
manifest.json: Structured library metadata, read counts, expected format, creation timestamp, and assigned project labels.clones.json: Complete JSON dataset of all evaluated candidate clones and metrics.charts.json: Visual analytics distribution curves, depth tiers, loop lengths, and kinetics.plate_summary.json: Microplate well-by-well read depth and demultiplexing metrics (if plate maps were provided).clones.fasta: Formatted multi-FASTA file of translated protein sequences (with Light chain_LCstrictly before Heavy chain_HC).clones_nucleotide.fasta: Formatted multi-FASTA file of clean, in-frame Frame 1 domain nucleotide sequences (with Light chain_LCstrictly before Heavy chain_HC).clones_nucleotide_flanked.fasta: Formatted multi-FASTA file of variable domains flanked by detected dual-index barcodes (5'-i5-[Domain]-i7-3').clones_nucleotide_amplicons.fasta: Formatted multi-FASTA file of unclipped native consensus reads as sequenced.barcode_sample_sheet.csv: Comprehensive 23-column CSV mapping wells, barcodes, domain sequences, flanked constructs, and full amplicons.
References
-
IMGT Unique Numbering & Variable Domain Structure:
- Lefranc M-P, et al. "IMGT unique numbering for immunoglobulin and T cell receptor variable domains and Ig superfamily V-like domains." Dev Comp Immunol. 2003 Jan;27(1):55-77. doi: 10.1016/S0145-305X(02)00039-3.
-
AIRR Community Immune Repertoire Standards:
- Rubelt F, et al. "AIRR Community recommendations for sharing immune-repertoire sequencing data." Nat Immunol. 2017 Nov;18(12):1274–1278. doi: 10.1038/ni.3873.
- Vander Heiden JA, et al. "AIRR Community Standardized Representations for Annotated Immune Repertoires." Front Immunol. 2018 Sep;9:2206. doi: 10.3389/fimmu.2018.02206.
-
FASTQ Phred Quality Scores & Sanger Standard:
- Ewing B, Green P. "Base-calling of automated sequencer traces using Phred. II. Error probabilities." Genome Res. 1998 Mar;8(3):186-94. doi: 10.1101/gr.8.3.186.
- Cock PJA, et al. "The Sanger FASTQ file format for sequences with quality scores, and the Solexa/Illumina FASTQ variants." Nucleic Acids Res. 2010 Apr;38(6):1767-71. doi: 10.1093/nar/gkp1137.
-
AntPack Profile HMM Annotation:
- Variable domain boundary detection and IMGT numbering are determined using AntPack.
-
UMAP: Uniform Manifold Approximation and Projection for Dimension Reduction:
- McInnes L, Healy J, Melville J. "UMAP: Uniform Manifold Approximation and Projection for Dimension Reduction." arXiv preprint arXiv:1802.03426, 2018. doi: 10.48550/arXiv.1802.03426.