Germline Evaluation
Evaluate multiple antibody candidates against reference germlines from discovery and therapeutic target species, contrasting auto-detected origin templates with target species frameworks, CDR divergence, and alternative candidate rankings.
This tool is essential for preclinical antibody discovery campaigns, humanization assessment, cross-species lead characterization, and evaluate-at-scale workflows across entire candidate repertoires.
Accessing the Tool
Select one or more antibody entries in the Project View (using row checkboxes or the global selection control). Go to the Analysis menu and select Germline Eval. This will open the Germline Evaluation workspace in a new tab.
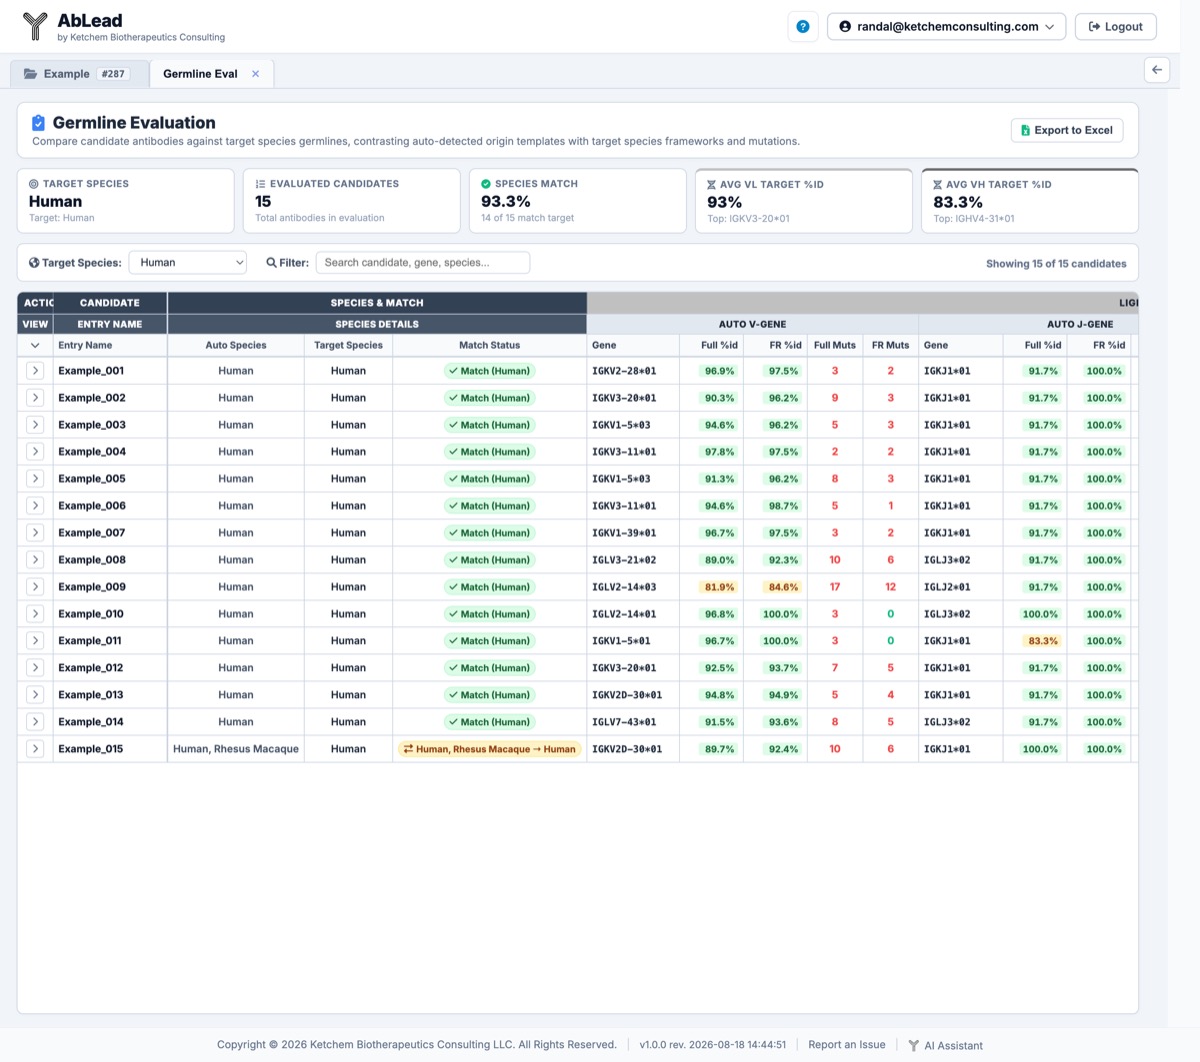
Executive Summary & Target Species Selection
The top toolbar and KPI summary cards provide an immediate high-level overview of repertoire concordance against your selected target species:
- Target Species Selector: Choose from 10 supported reference species. Changing the target species triggers real-time AJAX re-evaluation of all selected candidates without reloading the page.
- Target Species KPI: Displays the active target organism and evaluation scope.
- Evaluated Candidates KPI: Reports the total number of candidate antibodies currently analyzed.
- Species Match KPI: Reports the count and percentage of candidates whose auto-detected origin germline naturally matches the selected target species.
- Avg VL Target % Identity KPI: Reports mean variable light domain framework identity against target germlines, along with the most frequently observed top matching target V-gene.
- Avg VH Target % Identity KPI: Reports mean variable heavy domain framework identity against target germlines, along with the most frequently observed top matching target V-gene.
- Filter Input: Live text search that filters candidate rows by entry name, auto species, target species, or specific V/J gene identifiers across both chains.
Automatic Majority Species Pre-Selection
To eliminate manual configuration steps when switching between campaigns, Germline Eval automatically determines and pre-selects the starting Target Species based on the majority species of the evaluated candidates:
- Zero-Computation Majority Voting: The system reads the pre-determined variable domain species metadata (
VH Species,VL Species) already established during initial sequence ingestion. No heavy sequence alignments or machine learning models are re-executed to make this determination. - Context-Aware Defaults: If the majority of selected candidates originate from Mouse (e.g., from a murine hybridoma or immunization campaign), the tool opens with Mouse pre-selected as the Target Species, surfacing natural germline fidelity and somatic hypermutation. If the selected pool consists primarily of human or humanized sequences, it defaults to Human. If species cannot be determined or there is a tie, it defaults to Human.
- Seamless Cross-Species Exploration: Researchers can switch to any other reference organism using the Target Species Selector dropdown—such as selecting Human for murine hits to evaluate humanization potential, or Rhesus Macaque to investigate non-human primate (NHP) cross-reactivity frameworks.
Evaluation Grid & 3-Tier Multi-Header Hierarchy
The main evaluation table displays 45 columns structured into an intuitive 3-tier hierarchy that separates auto-detected origins from target species assignments:
-
Tier 1 (Super Headers):
- Candidate Information (Columns 1–5): Action toggle, Entry Name, Auto Species, Target Species, and Match Status.
- Light Chain (VL) - Auto vs. Target (Columns 6–25): Styled with Silver (
#C0C0C0) and dark text in compliance with AbLead's canonical color standards. - Heavy Chain (VH) - Auto vs. Target (Columns 26–45): Styled with Dim Gray (
#696969) and white text.
-
Tier 2 (Sub-Group Headers):
- Subdivides each chain into distinct gene assignment panels: Auto V-Gene, Auto J-Gene, Target V-Gene, and Target J-Gene.
-
Tier 3 (Column Headers):
- Each of the eight gene groups provides five standardized developability and identity metrics:
- Gene: Closest matching germline gene allele identifier (e.g.
IGHV1-69*01). - Full %id: Percent sequence identity across the full variable gene region.
- FR %id: Framework-specific percent sequence identity (evaluating FR1–FR3 for V-genes and FR4 for J-genes).
- Full Muts: Total mutation count across the full variable gene region.
- FR Muts: Total mutation count within framework regions.
- Gene: Closest matching germline gene allele identifier (e.g.
- Each of the eight gene groups provides five standardized developability and identity metrics:
Sticky Column Navigation
To allow comfortable horizontal navigation across 45 metrics columns:
- Column 1 (
Action): Anchored toleft: 0(width: 44px). The chevron toggle remains pinned in view at all times. - Column 2 (
Entry Name): Anchored toleft: 44px(min-width: 140px) with a persistent divider border (border-right: 2px solid #cbd5e1). As you scroll horizontally to inspect deep Heavy or Light chain columns, candidate identifiers remain locked on screen.
Color-Coded Value Thresholds
All numerical data cells feature high-contrast color badges reflecting developability and sequence identity standards:
-
Identity Badges (
Full %id,FR %id):- High (\(\ge 85.0\%\)): Soft green background (
#DCFCE7) with dark green bold text (#166534). - Moderate (\(70.0\% - 84.9\%\)): Soft amber background (
#FEF3C7) with dark amber bold text (#92400E). - Low (\(< 70.0\%\)): Soft red background (
#FEE2E2) with dark red bold text (#991B1B).
- High (\(\ge 85.0\%\)): Soft green background (
-
Mutation Counts (
Full Muts,FR Muts):- \(0\) mutations: Bold green text (
#10B981) indicating 100% germline framework conservation. - \(> 0\) mutations: Bold red text (
#EF4444) highlighting framework substitutions.
- \(0\) mutations: Bold green text (
-
Match Status Badge:
- Match: Green badge (
#DCFCE7) with checkmark indicating natural concordance with the target species. - Divergent: Amber badge (
#FEF3C7) displaying the cross-species transition path (e.g.Mouse → Human).
- Match: Green badge (
Interactive Multi-Column Sorting and Filtering
The evaluation table incorporates AbLead's centralized TableFilterSort engine across all 45 data columns:
-
Interactive Multi-Column Sorting:
- Click any column header to sort by that metric.
- Uses a 3-click cycle: Ascending (\(\blacktriangle\)) \(\rightarrow\) Descending (\(\blacktriangledown\)) \(\rightarrow\) Default / Clear.
- Clicking multiple columns builds a composite tiebreaker hierarchy, with numerical rank badges (
1,2,3...) indicating sort precedence.
-
Column Filtering Popovers and Search Syntax:
- Click the funnel icon in any column header to open a filter popover.
- Supports Google-norm negation syntax (e.g.
-rhesusorNOT rhesusto exclude candidates), exact quoted literal searches (e.g."-rhesus"), comma-separated multi-value searches (e.g.human, mouse, -rhesus), numeric comparisons (>,<,>=,<=, and=), and numerical value ranges (e.g.80-90). - For a complete reference on search operators, see the Column Filtering and Google-Norm Search Syntax in Project View.
-
Active Filters and Sorts Bar:
- Displays blue filter chips and purple sort chips directly above the grid.
- Click the \(\times\) on any chip to remove that individual filter or sort, or click Clear All to reset the entire table.
-
Filter-Aware Excel Export and State Persistence:
- Active sorts and column filters persist in browser session storage (
sessionStorage) across page visits. - Clicking Export to Excel respects all active filter criteria so exported workbooks match current table rows.
- Active sorts and column filters persist in browser session storage (
Candidate Detail View & Sequence Alignments
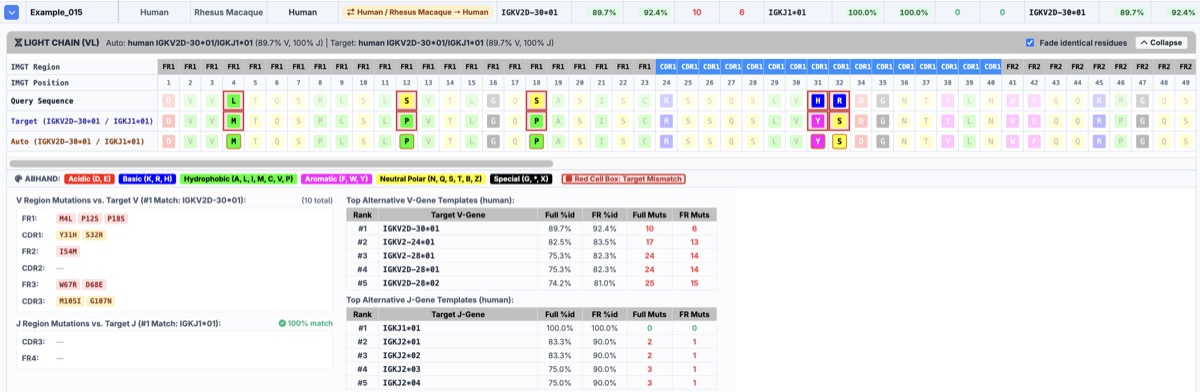
Click the chevron in Column 1 for any candidate to expand its comprehensive sequence alignment and alternative template analysis card:
Viewport-Pinned Card Architecture
The expanded detail view is wrapped in a viewport-synced sticky container (.detail-sticky-wrapper). Rather than expanding the entire table width across thousands of pixels, the detail card remains pinned to the visible window, providing a self-contained workspace that never blows out page layout. A dedicated Collapse button in each chain header lets you close the card directly without scrolling back to the row toggle.
No-Wrap ABHAND Residue Alignment
Each chain includes a non-wrapping sequence alignment strip:
- Flush Title Column: Row labels (IMGT Region, IMGT Position, Query Sequence, Target Germline, Auto Germline) remain pinned on the left with zero bleed-through as residues scroll underneath.
-
Vivid ABHAND Amino Acid Coloring: Residues are rendered in standard physicochemical property colors:
- Acidic (D, E): Red (
#FF0000) - Basic (K, R, H): Blue (
#0000FF) - Hydrophobic (A, L, I, M, C, V, P): Green (
#00FF00) - Aromatic (F, W, Y): Magenta (
#FF00FF) - Neutral Polar (N, Q, S, T, B, Z): Yellow (
#FFFF00) - Special (G, *, X): Black (
#000000) / Gaps in White (#FFFFFF)
- Acidic (D, E): Red (
-
Red Cell Box Target Mismatches: Target mismatch positions are framed with a prominent 2px red inset cell box (
box-shadow: inset 0 0 0 2px #dc2626; background: #fee2e2;) surrounding both the Query and Target table cells. This frames the mismatch clearly without clashing against underlying amino acid background colors. - Consensus Fade Mode: Toggle the Fade identical residues checkbox in the card header. Identical matching positions fade into the background (
opacity: 0.18), causing target mismatches and framework substitutions to stand out immediately.
Regional Mutation Breakdown and Alternative Template Ranking
Below the alignment strip, a compact subgrid provides:
-
Regional Mutation Breakdown:
- V Region: Partitioned substitutions relative to the top target V-gene across FR1, CDR1, FR2, CDR2, FR3, and CDR3.
- J Region: Partitioned substitutions relative to the top target J-gene across CDR3 and FR4.
- Deduplicated and Color-Coded: Each residue substitution appears exactly once under its respective structural framework or loop region. Structural framework substitutions (FR1, FR2, FR3, and FR4) are highlighted in red tags (
#FEE2E2/#991B1B), while complementarity-determining region mutations (CDR1, CDR2, and CDR3) are styled in amber tags (#FEF3C7/#92400E). Regions with zero mutations display a clean, muted dash indicator (—), and section headers display green checkmarks when achieving 100% germline identity.
-
Top Alternative Template Tables:
- Side-by-side ranking tables displaying the top 5 alternative V-Gene and J-Gene candidate templates for the selected target species.
- Reports candidate Rank (
#1to#5), Target Gene Name, Full % Identity, Framework % Identity, Full Mutations count, and Framework Mutations count in a compact, readable table.
Multi-Tab Excel Export
Click the Export to Excel button in the header toolbar to generate a publication-ready .xlsx workbook:
-
Sheet 1 (Germline Evaluation):
- Executive Metadata Banner: Contains project name, evaluated candidate counts, target species, concordance percentage, and export timestamp.
- 3-Tier Header Hierarchy: Full multi-tier header structure matching web platform styling, with Silver fills for Light Chain and Dim Gray fills for Heavy Chain.
- Main Grid Cell Formatting: Data cells across all 40 metrics columns reflect the web dashboard's color coding:
- Identity percentages formatted with green (\(\ge 85\%\)), amber (\(70\%-85\%\)), and red (\(< 70\%\)) fills and dark bold text.
- Mutation counts formatted with bold green text for zero and bold red text with light red tint for non-zero counts.
- Target gene names formatted in bold navy text.
- Match status formatted with green (match) and amber (divergent) badges.
- Auto-fitted column widths and thin cell borders.
-
Sheet 2 (Target Candidates Detail):
- Comprehensive breakdown of the top 5 alternative V-gene and J-gene candidates for every evaluated antibody.
- Reports Entry Name, Chain (Light/Heavy with canonical color fills), Gene Type (V/J), Rank (
#1–#5), Gene Name, Full % Identity, Framework % Identity, Framework % Homology, Full Mutations, and Framework Mutations. - All percentage identity and homology cells are styled with matching threshold color fills.
Supported Reference Species
The Germline Evaluation tool evaluates sequences against curated reference databases across 10 discovery and therapeutic species:
| Common Name | AbLead Label | Typical Therapeutic & Discovery Use Cases |
|---|---|---|
| Human | Human | Primary target for humanization, humanness (OASign/Sapiens), and clinical developability benchmarking |
| Mouse | Mouse | Murine hybridoma discovery, transgenic platforms, and preclinical mouse model characterization |
| Rhesus Macaque | Rhesus Macaque | Non-human primate (NHP) safety, pharmacokinetic (PK), and tolerability profiling |
| Rabbit | Rabbit | High-affinity rabbit monoclonal discovery, diagnostic antibody development, and immune repertoire analysis |
| Rat | Rat | Rat hybridoma campaigns, OmniRat transgenic models, and autoimmune disease models |
| Alpaca / Camelid | Alpaca / Camelid | Single-domain (VHH / nanobody) engineering, multispecifics, and modular binders |
| Dog (Canine) | Dog (Canine) | Veterinary therapeutics, caninization campaigns, and comparative companion animal oncology |
| Cat (Feline) | Cat (Feline) | Veterinary therapeutics, felinization campaigns, and feline chronic disease models |
| Pig (Porcine) | Pig (Porcine) | Xenotransplantation research, swine immunology, and preclinical surgical models |
| Chicken (Avian) | Chicken (Avian) | Avian immune repertoire diversification, phylogenetic distance epitope discovery, and IgY engineering |